- Published on
A Practical Guide to Code Quality Metrics
- Authors

- Name
- Gabriel
- @gabriel__xyz
Code quality metrics are basically quantitative scores that help you gauge the health, maintainability, and overall efficiency of your codebase. You can think of them as a diagnostic report for your software—they’re fantastic for spotting hidden issues before they escalate into massive headaches.
In short, they turn subjective water-cooler talk about "good code" into objective, actionable data.
Why Code Quality Metrics Matter
Ever tried driving a car without a dashboard? You wouldn’t have a clue about your speed, how much gas you have left, or if the engine is about to overheat. That’s pretty much what it’s like to develop software without code quality metrics. You’re flying blind and just hoping for the best.
These metrics give developers the crucial feedback loop they need to build software that’s not just functional, but also reliable, scalable, and cost-effective in the long run.
By keeping an eye on the right data, your team can proactively pinpoint risky areas in the code, slash the time spent squashing bugs, and seriously cut down on long-term maintenance costs. Good metrics also create a shared language between developers and business stakeholders, getting everyone on the same page about what "quality" actually means.
The Four Pillars of Quality
Most code quality metrics can be sorted into four main categories. Each one shines a light on a different aspect of your software’s health. This infographic gives a nice, clean breakdown of these core pillars.
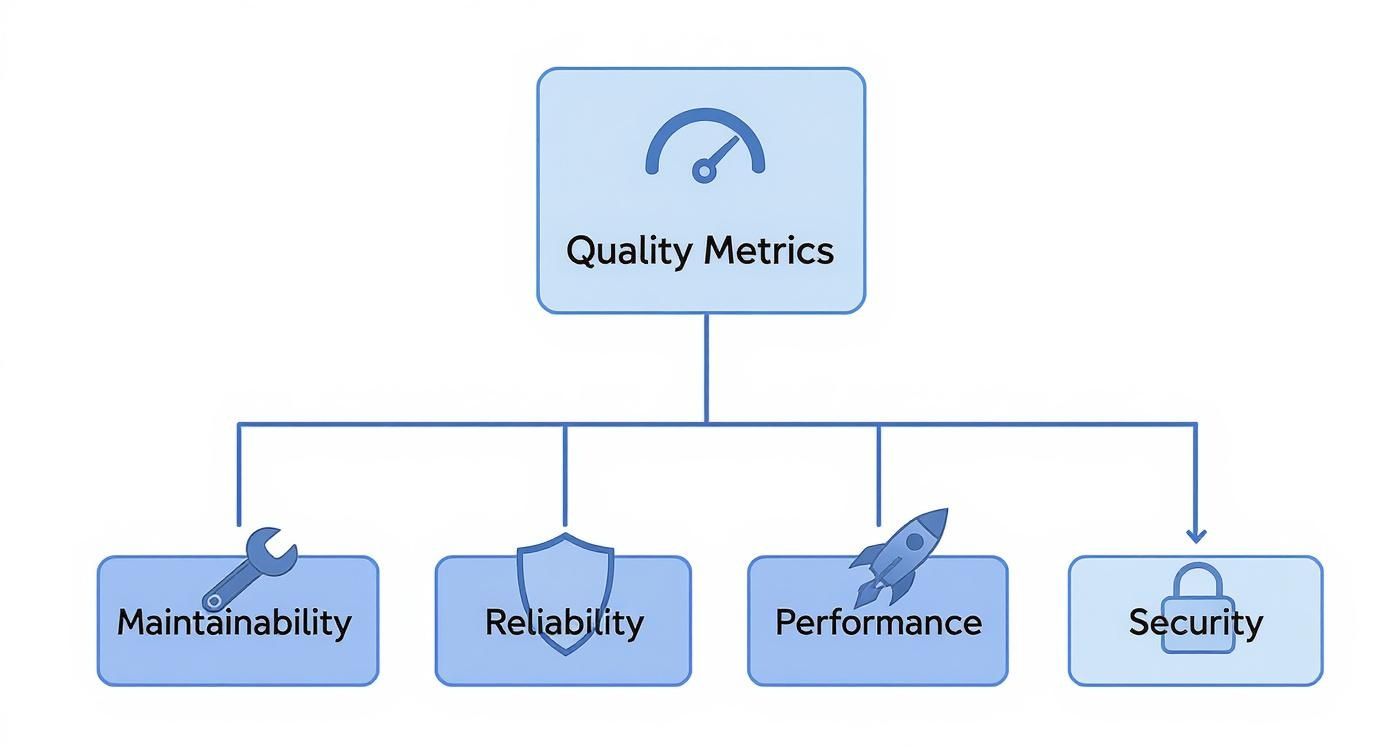
This kind of structure helps teams zero in on what truly matters, whether that’s making the code easier to change (Maintainability) or shoring up its defenses against outside threats (Security).
Focusing on these areas is also key to managing that constant tug-of-war between shipping fast and building something solid. For a deeper dive into this balancing act, you can check out our guide on the key trade-offs between code quality and delivery speed.
At the end of the day, investing in quality isn't about slowing down. It’s about building a stable foundation that actually lets you innovate faster and more predictably down the line.
Good code is its own best documentation. As you’re about to add a comment, ask yourself, ‘How can I improve the code so that this comment isn’t needed?’
This idea really gets to the heart of what quality metrics are all about: encouraging code that is so clear, simple, and robust that it speaks for itself.
To make things a bit clearer, here's a quick summary of the four main categories of code quality metrics and what they track.
The Four Pillars of Code Quality Metrics
| Category | What It Measures | Example Metrics |
|---|---|---|
| Maintainability | How easy it is to modify, fix, or extend the code. | Cyclomatic Complexity, Code Churn |
| Reliability | The stability and consistency of the software in operation. | Defect Density, Code Coverage |
| Performance | The speed and efficiency of the application under load. | Response Time, Memory Usage |
| Security | The codebase's resilience against vulnerabilities and threats. | Vulnerability Scans, Dependency Health |
Keeping these four pillars in mind gives you a balanced, holistic view of your codebase's health, ensuring you're not just building features, but building them to last.
Essential Maintainability Metrics You Should Track
If reliability and performance metrics make sure your software runs well today, maintainability metrics ensure it can still be improved tomorrow. Think of it like this: you can either have a well-organized workshop or a cluttered garage. One lets you get to work quickly and efficiently, while the other turns every small task into a frustrating chore.
That's what maintainability is all about—keeping your codebase clean, logical, and easy for any developer to pick up and start working on.
Tracking these numbers is your best defense against the slow creep of technical debt. When code becomes a tangled mess that’s hard to understand and even harder to change, development slows to a crawl, bugs pop up everywhere, and innovation grinds to a halt.

Unraveling Cyclomatic Complexity
One of the most powerful maintainability metrics is Cyclomatic Complexity.
Imagine your code is a road map. A simple, straight road from point A to point B is a breeze to follow. Now, picture a map with dozens of intersections, roundabouts, and branching paths. Navigating that is just asking for a wrong turn.
Cyclomatic Complexity essentially measures how many of those "intersections" (like if, while, and for statements) exist in your code. The higher the score, the more complex the path, making the code harder to understand, test, and maintain.
A low complexity score is a strong signal of a healthy codebase. It tells you that functions are focused, easy to reason about, and less likely to hide sneaky bugs. Keeping this number down is a direct investment in your team's productivity.
In practice, any function with a high complexity score is a flashing neon sign telling you it needs to be refactored. It's almost always a sign that the function is trying to do too much and should be broken down into smaller, more focused pieces.
Interpreting Complexity Scores
So, what’s a "good" score? Thankfully, there are some well-established guidelines.
A cyclomatic complexity score between 1 and 10 is generally considered low-risk and perfectly manageable. As the score climbs, so does the risk. Scores from 11 to 20 signal moderate complexity that needs more thorough testing, while anything over 20 is a red flag for a highly complex and potentially problematic chunk of code. You can find more insights on how code quality scores are used at distantjob.com.
Other Key Maintainability Metrics
Beyond just complexity, a few other metrics give you a more complete picture of your codebase's health.
Here are the essential ones to keep an eye on:
*   **Code Churn:** This tracks how often code gets rewritten or deleted shortly after being committed. If you see high churn in a specific file, it could mean the requirements are unstable, the logic is confusing, or there's a recurring bug developers just can't seem to squash for good.
*   **Maintainability Index:** This is a neat composite score calculated from other metrics, including Cyclomatic Complexity. It gives you a single, easy-to-digest value (usually from **0 to 100**) representing how easy the code is to maintain. The higher the score, the better.
*   **Halstead Complexity Measures:** This is actually a suite of metrics that analyzes the operators (like `+`, `*`, `if`) and operands (variables and constants) in your code. It helps quantify things like the program's length, its "vocabulary," and the sheer mental effort needed to understand it.
The Impact of AI on Modern Code Quality Metrics
AI coding assistants like GitHub Copilot are changing the game. It’s like having a super-fast junior developer on your team, churning out code in seconds. While this speed is fantastic for productivity, it also brings a new set of challenges and forces us to rethink which code quality metrics we should be watching.
Let's be clear: AI is great at the task you give it right now. But it doesn’t have the foresight of a senior engineer who’s thinking about how a piece of code will age or how it fits into the larger system a year down the road. This means our teams need to be more vigilant than ever.
This shift isn't just about writing code; it's also transforming how we validate skills, with tools like AI-driven technical skills assessments becoming more common to ensure developers can effectively manage this new landscape.
New Metrics for the AI Era
With AI-generated code flooding our repositories, some metrics are becoming mission-critical for keeping a codebase healthy. Without a watchful eye, you can rack up a new kind of technical debt—one driven by the specific patterns of AI tools.
Here are a few metrics that now demand a closer look:
*   **Code Duplication:** AI doesn’t always know your codebase. It might generate similar solutions for similar problems in different places, leading to duplicated logic. This is a maintenance nightmare—a bug found in one spot has to be fixed everywhere it was copied.
*   **Code Churn:** This metric is all about how often code gets rewritten or deleted right after it’s added. If AI-generated code has a high churn rate, it’s a big red flag. It tells you the initial output probably wasn’t quite right and needed a lot of human cleanup.
*   **Code Reuse:** A good developer will often pull existing logic into a shared function instead of reinventing the wheel. AI assistants, on the other hand, tend to generate brand-new code from scratch. Over time, this can lead to a bloated, less maintainable system.
Data Reveals Emerging AI Patterns
This isn't just a gut feeling; the data is starting to tell a story. A major study looked at over 211 million lines of code from tech giants like Google and Microsoft between 2020 and 2024. What they found was pretty telling.

AI-assisted code had a noticeable spike in code duplication and a big jump in short-term churn. The research also found a drop in code reuse, backing up the idea that AI prefers creating new code over refactoring what’s already there.
The core challenge with AI-assisted development is not speed, but stewardship. The goal is to leverage AI for rapid creation while using robust code quality metrics to ensure the result is sustainable, not just functional for today.
At the end of the day, these tools are powerful allies, but they need a new layer of human oversight. By adapting how we monitor our code and focusing on these emerging code quality metrics, teams can get all the benefits of AI speed without sacrificing the long-term health of their software. It’s about being proactive to make sure today's productivity boost doesn't become tomorrow's maintenance nightmare.
Of course, here is the rewritten section.
Measuring Reliability and Performance
While maintainable code keeps your development team humming along, reliability and performance metrics are all about the end-user. Does your software deliver a stable, positive experience? Think of it like building a bridge. An elegant, simple design is easy for engineers to work on (that’s maintainability), but if it can’t handle traffic without shaking or collapsing, it has failed its most important job.
These code quality metrics shift the focus from internal health to external impact. They measure how consistently your software does its job and how quickly it responds when someone actually uses it.
Gauging Application Stability
Stability is the bedrock of user trust. Plain and simple. If an application is buggy or crashes all the time, users will leave and probably won't come back. Measuring reliability helps you catch these issues before they burn through that trust.
Two of the most important metrics to keep an eye on here are:
*   **Mean Time Between Failures (MTBF)**: This is a fancy way of saying, "How long does our app run before it breaks?" It calculates the average time your application chugs along without hitting a critical failure. A high MTBF is a fantastic sign of a robust and stable system.
*   **Code Coverage**: This is often talked about as a testing metric, but it’s directly tied to reliability. It measures the percentage of your code that gets poked and prodded by automated tests. High coverage doesn't guarantee a bug-free app, but low coverage is practically a welcome mat for hidden bugs.
These aren't just abstract numbers for a dashboard; they are vital signs for your software's health. In fact, ignoring code quality can lead to some pretty dramatic consequences. A massive analysis of over 9,000 code files from academic research found that a staggering 74% failed to run error-free in a clean environment. You can dig into the full study on the challenges of research software quality on nature.com.
That study just goes to show that even when money isn't on the line, a lack of focus on reliability metrics leads to some serious quality problems.
Your most unhappy customers are your greatest source of learning. By measuring reliability, you are essentially listening to what your application is telling you about its own pain points before your customers have to.
Monitoring Speed and Efficiency
Performance is just as critical as stability. A slow, laggy application feels broken, even if it never technically crashes. Users expect near-instant responses, and failing to deliver that snapiness can be just as damaging as a bug.
A couple of key performance metrics include:
*   **Response Time**: How long does it take for the app to react to a user's click? Whether it's loading a page or submitting a form, this metric tells you if your users are waiting around.
*   **Memory Usage**: This tracks how much memory your application is hogging. Excessive usage can slow down the entire system and eventually lead to those dreaded crashes.
By setting up automated monitoring and testing frameworks, you can gather this data constantly. This proactive approach ensures that every new feature is not only functional but also fast and reliable, safeguarding the user experience with every single commit.
Tools and Best Practices for Implementing Metrics
This dashboard from SonarQube is a perfect example of how to make metrics tangible. It turns abstract concepts like code quality metrics into a clear, at-a-glance overview that tells you exactly where your project stands.
But knowing the theory is only half the battle. To actually put these metrics to work, you need the right tools and a solid team strategy. Just installing some software and hoping for the best won't cut it. Real success comes from weaving these tools into your daily development workflow and building a culture where quality is a shared responsibility, not just another box to check.
Choosing Your Code Quality Toolkit
The market is packed with fantastic tools that automate the measurement of code quality. They generally fall into two camps: static analysis tools that scan your code for potential problems without actually running it, and code coverage tools that show you how much of your code is being tested.
When you're trying to figure out which tool is right for you, it helps to see what each one brings to the table.
Popular Code Quality Tools Comparison
Here’s a quick look at some of the leading tools out there, what they do best, and who they’re for. This should help you narrow down the options based on your team's specific needs.
| Tool | Primary Focus | Key Features | Best For |
|---|---|---|---|
| SonarQube | Static Code Analysis | Detects bugs, vulnerabilities, and code smells. Calculates technical debt. | Teams needing a comprehensive, all-in-one quality management platform. |
| CodeClimate | Maintainability & Test Coverage | Provides a simple GPA-style rating for maintainability. Integrates coverage reports. | Startups and teams looking for automated code review and clear, simple feedback. |
| JaCoCo / Istanbul | Code Coverage | Generates detailed reports on line, branch, and method coverage for Java and JavaScript. | Projects that need to rigorously track and enforce test coverage standards. |
| New Relic | Performance Monitoring | Real-time monitoring of application performance, response times, and error rates. | Organizations focused on user experience and application reliability in production. |
No matter which primary tool you choose, it's also worth exploring some of the top AI code review tools available today. These can complement your existing setup by offering intelligent suggestions and automating the more tedious parts of the review cycle.
Best Practices for Team Implementation
Let's be clear: tools are only as good as the team culture that surrounds them. Without the right habits and processes, even the most powerful software will just gather digital dust.
The goal is to make quality visible and collaborative. Metrics should be a compass that guides improvement, not a hammer used to assign blame. When the entire team owns quality, the codebase benefits immensely.
To get the most out of your metrics program, focus on these four practices:
*   **Set Up Quality Gates in CI/CD:** Don't let bad code slip through the cracks. Integrate your tools directly into your CI/CD pipeline to create a "quality gate." This gate can automatically fail a build if it doesn't meet your standards for things like code coverage or complexity, stopping low-quality code before it ever reaches production.

*   **Focus Code Reviews on Data:** Take the subjectivity out of code reviews. Instead of getting into debates based on personal preference, use the data from your tools to have objective conversations. A comment like, "This function's complexity score is **15**; can we simplify it?" is far more productive than "This seems too complicated."

*   **Automate Notifications:** Keep everyone in the loop without creating a firehose of alerts. For instance, you can easily set up [code quality checks with GitHub Actions and Slack](https://blog.pullnotifier.com/blog/code-quality-checks-with-github-actions-and-slack) to send targeted notifications right when a pull request needs attention. This keeps things moving without adding to the noise.

*   **Foster a Culture of Shared Responsibility:** Make it crystal clear that code quality isn't just one person's job—it's everyone's. Celebrate when the team makes improvements, talk openly about quality challenges in retrospectives, and treat technical debt as a shared priority that needs regular attention.
Got Questions About Code Quality Metrics? We’ve Got Answers.
Diving into the world of code quality metrics always brings up some practical questions. Let's tackle the common ones that pop up for developers and managers trying to turn raw data into real improvements.
Are High Code Coverage Numbers Always a Sign of Good Quality?
Not on their own, no. While hitting a high code coverage number (think 80% or more) is a great first step, it only tells you how much of your code your tests ran. It says absolutely nothing about how good those tests are.
You could have a test that executes a complex function but never actually bothers to check if the output is correct. Technically, that code is "covered," but the test is completely useless. Real quality comes from pairing high coverage with meaningful assertions that prove your code behaves as expected under all sorts of conditions.
Code coverage is like a smoke detector. It’ll warn you about a fire (untested code), but it can’t tell you if the house is built to last. For that, you need both the alarm and a solid foundation of well-written tests.
Think of it as a baseline, not the finish line. High coverage is a fantastic way to reduce the risk of totally untested logic sneaking into production, but it's only one part of a much bigger picture.
What Should We Do When Our Metrics Look Bad?
First off, don't panic. Bad metrics aren't a sign to start pointing fingers; they're an opportunity for an objective, data-driven chat about how to improve the codebase. Think of a sudden dip in a key metric as a diagnostic tool, not a report card.
When you spot a troubling trend, let it guide your investigation. Start asking specific questions:
*   **Is complexity creeping up in one particular module?** That could be a signal to refactor that area before it becomes a real headache.
*   **Is code churn unusually high for a new feature?** Maybe the requirements weren't clear, or the first pass at implementation was a bit rushed.
*   **Did defect density spike right after a release?** This points toward needing a better testing strategy or a more thorough review process for that part of the system.
The key is to use the data to start a conversation. Bring the numbers to your team's next retrospective and work together to pick one or two concrete areas to focus on in the next sprint. That’s how you turn a negative signal into a positive, actionable plan.
How Can We Balance Speed and Quality?
Ah, the classic dilemma. But here's the thing: it’s not really a zero-sum game. The real goal is sustainable velocity, not just a short-term burst of speed. Cutting corners on quality to ship faster almost always costs you more time down the road, thanks to a mountain of bug fixes and maintenance nightmares.
Here’s how you strike a healthier balance:
- Automate Everything You Can: Set up CI/CD pipelines with automated quality gates. This bakes your quality standards right into the workflow, so you're not slowing developers down with endless manual checks.
- Define Your "Good Enough": Agree as a team on acceptable thresholds for your most important code quality metrics. Not every single file needs 95% test coverage, but your critical business logic absolutely should.
- Tackle Technical Debt Intentionally: Carve out a small slice of every sprint (even just 10-15% of your time) to pay down technical debt. It’s like making regular payments on a loan—it prevents quality from slowly eroding until it collapses.
When quality is a visible, automated part of your process, speed and stability start working together instead of fighting each other.
Ready to cut through the noise and improve your team's code review process? PullNotifier integrates seamlessly with GitHub and Slack to deliver clear, real-time pull request updates, helping you track progress and maintain quality without overwhelming your channels.