- Published on
How to Check Uptime in Windows: 5 Easy Methods
- Authors

- Name
- Gabriel
- @gabriel__xyz
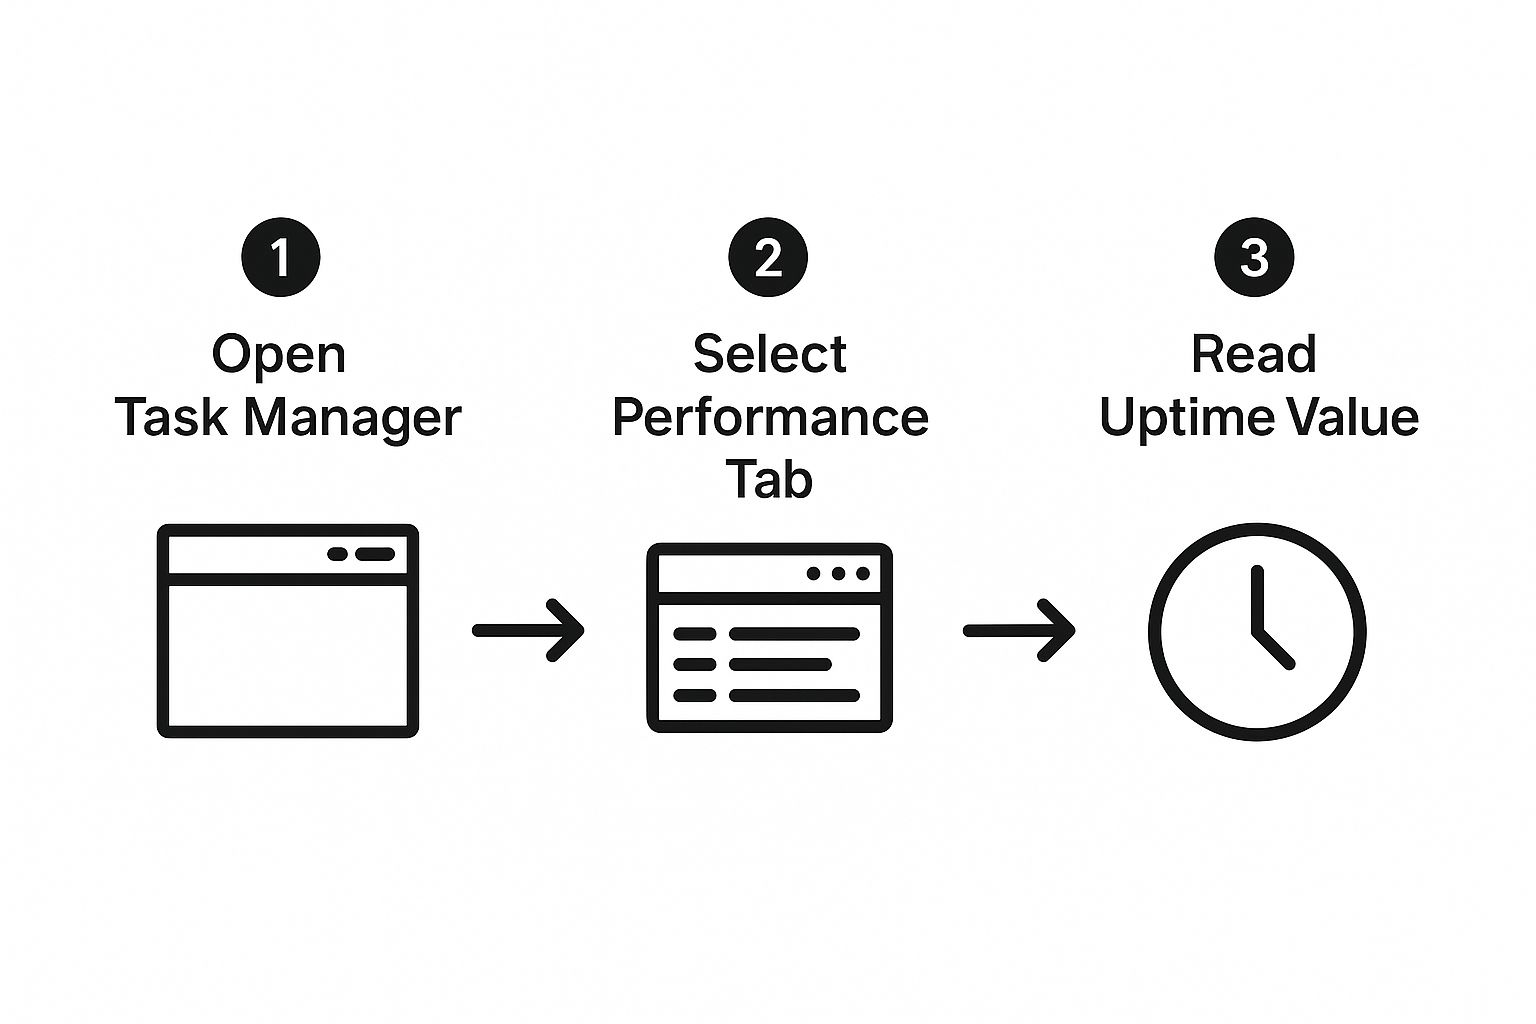
Ever found your PC acting sluggish and wondered if it's just tired or if a remote server is as stable as it should be? One of the quickest ways to check is with the Task Manager. Just hit Ctrl+Shift+Esc, flip over to the Performance tab, and you'll see "Up time" right there under the CPU section.
Why Tracking Windows Uptime Is So Important

Knowing how long your Windows machine has been running is more than just a party trick for tech geeks—it’s a fundamental diagnostic tool. It gives you a clear snapshot of system stability, helping you figure out if random reboots are happening or when it’s safe to schedule that critical maintenance window. This simple number is often the first breadcrumb on the trail to solving performance headaches.
This guide will walk you through five different ways to check your system's uptime, each suited for different needs and skill levels. Whether you're a casual user trying to figure out why your laptop is acting up or an IT pro managing a fleet of servers, you'll find a method here that works for you.
The Impact of Uptime on System Reliability
A long, uninterrupted uptime is usually a sign of a healthy, stable machine. On the flip side, frequent and unexpected reboots can point to some serious underlying problems. This isn't just a local issue; it mirrors what's happening in the wider world of digital infrastructure. A recent industry report, for instance, noted a drop in average API uptime from 99.66% to 99.46% in just one year. That might sound small, but it adds up to an extra 90 minutes of downtime every month for cloud-based services.
Key Takeaway: A surprisingly low uptime on a server could be a red flag for failing hardware, a botched Windows update causing silent crashes, or even power supply problems that need immediate attention.
For a more complete picture, many organizations rely on dedicated IT infrastructure monitoring tools that keep an eye on uptime along with other critical performance metrics. And for developers or engineering managers, tying system monitoring into your daily workflow is key. If that sounds like you, you might find our specialized developer productivity tools helpful for streamlining these kinds of processes.
Find System Uptime Instantly with Task Manager
If you need to know your system's uptime and you want the answer right now, Task Manager is your go-to. It's easily the most straightforward method, giving you a quick visual without ever touching a command line.
I find myself using this all the time, especially when a machine feels a bit sluggish. A quick check can instantly tell me if a simple reboot might be the solution after a long-running session.
Just pop it open with the classic shortcut: Ctrl+Shift+Esc.
Once it's open, head over to the Performance tab. You'll see a few options, but you want to click on CPU. In the main view, you’ll find the Up time listed clearly at the bottom—counting days, hours, minutes, and seconds since the last restart. No commands, no fuss.
As you can see, the uptime is right there at the bottom, making it impossible to miss among the other CPU performance stats. It's a simple, direct way to get the info you need.
Use the Command Prompt for Detailed Boot Info
If you're more of a command-line person, you'll be happy to know the Command Prompt offers some powerful and precise ways to check uptime on Windows. This is a classic go-to for IT pros, and for good reason—the commands are easy to script, which is a lifesaver when you need to automate checks across a bunch of machines.
Instead of clicking through menus, you can get exactly what you need with a single line of text. It's incredibly efficient, especially when you're troubleshooting remotely or just need to pull data without bothering a user. I find it strikes the perfect balance between the dead-simple Task Manager and the more complex world of PowerShell.

Find the Exact System Boot Time
The systeminfo command is a data goldmine, but on its own, it spits out a ton of information—everything from the OS version to installed hotfixes. To get straight to the point, we can filter its output.
Just pop open the Command Prompt (search for cmd in the Start menu). Then, type this command and hit Enter:
systeminfo | findstr /B /C:"System Boot Time"
This little combo is incredibly handy. The pipe (|) takes all the output from systeminfo and feeds it directly into the findstr command. From there, findstr searches for and displays only the line that starts with "System Boot Time." You get the exact timestamp of the last reboot, with none of the extra noise.
Use the Net Statistics Command
Another great option in your toolkit is the net statistics workstation command. This one gives you a slightly different angle, focusing on network-related activity since the machine was last booted.
The "Statistics since" line right at the top is what you're looking for. It gives you a clean, immediate timestamp of when the system last came online, making it another super quick way to verify uptime.
This method is particularly useful because system stability is a huge factor in overall network health. While big data center outages are on the decline, failures caused by internal IT and networking issues have actually gone up, now accounting for 23% of impactful outages. Keeping a close eye on boot times can be a key part of diagnosing those tricky problems. You can dig deeper into these trends in recent outage analysis reports.
Get Fancy With PowerShell for Advanced Uptime Scripts
When you need more than just a quick glance, PowerShell is your go-to tool. It lets system admins and power users check uptime on Windows with a level of precision and flexibility that other methods just can't match. We're moving beyond simple timestamps here—this is for scripting, automation, and managing machines remotely.

The easiest way to jump in is with a single, powerful command. Fire up PowerShell and type this in:
(Get-Date) – (Get-CimInstance Win32_OperatingSystem).LastBootUpTime
This little one-liner is surprisingly smart. It grabs the current time with Get-Date and subtracts the system's LastBootUpTime, giving you a detailed timespan object showing exactly how long your machine has been running.
What's Happening in That Command?
The real workhorse here is Get-CimInstance. This modern cmdlet dives into the system's WMI (Windows Management Instrumentation) repository to pull management info. In our case, it’s grabbing the LastBootUpTime property from the Win32_OperatingSystem class.
So why does that matter? Because it’s scriptable. You can dump that output into a variable, play with it, and weave it into larger scripts for things like automated server health checks or scheduled reports. It's a game-changer for anyone managing more than one machine.
Imagine you need to check the uptime on a dozen remote servers. Instead of logging into each one, you could wrap this command in a script that connects to every machine and spits out a neat report. That's a massive time-saver and a must-have skill in modern IT.
Maintaining high uptime is a huge challenge in complex data centers. With persistent staffing shortages affecting nearly two-thirds of operators worldwide, efficient, script-based management isn't just a nice-to-have—it's essential. You can find more insights on these data center management challenges.
Making the Output Actually Readable
The default output from that command is functional, sure, but it's not exactly pretty. With just a few extra lines, we can whip up a script that formats the uptime into a clean, human-readable string like "15 Days, 8 Hours, 32 Minutes."
Here’s a quick script that does just that:
FormattedUptime = "Uptime.Days) Days, Uptime.Hours) Hours, Uptime.Minutes) Minutes" Write-Host "System Uptime: $FormattedUptime"
This snippet takes that timespan object, pulls out the specific days, hours, and minutes, and then stitches them together into a polished string. It turns a raw piece of data into something you can easily drop into an email report or a monitoring dashboard. This is what makes PowerShell an indispensable tool for serious system management.
How to Interpret Your System's Uptime Data
Finding your system's uptime is just the start; the real power comes from understanding what those numbers actually mean. The data you get when you check uptime on Windows is more than a simple timer—it’s a diagnostic clue that tells a story about your system’s health and stability.
A high uptime isn't always a badge of honor. On a personal laptop, running for weeks without a reboot might be the perfect explanation for why it feels sluggish and unresponsive. In that case, an uptime of several weeks is probably a bad thing, signaling a need for a fresh start to clear out memory and kill misbehaving processes. A quick restart is often the simplest fix.
What Is a Good Uptime for a Server
For a business-critical server, the story is completely different. Here, a long, uninterrupted uptime is precisely the goal. Consistency is everything, and an uptime measured in months indicates a stable environment, solid hardware, and well-behaved software. An unexpectedly low uptime on a server is an immediate red flag.
An abrupt reset could point to several serious issues:
- Hardware Failure: A faulty power supply or failing memory can easily cause spontaneous reboots.
- Problematic Updates: A recent Windows update or driver installation may have introduced instability.
- Overheating: If the cooling isn't sufficient, the system might be shutting down to protect itself.
By checking uptime regularly, you shift from a reactive to a proactive mindset. Instead of waiting for a total system failure, a surprisingly low uptime reading gives you an early warning to investigate before a minor hiccup becomes a major outage.
Digging Deeper with Event Viewer
To get the full picture, you can cross-reference your boot time with logs in the Windows Event Viewer. This tool keeps a detailed record of system events, including the specific reason for the last shutdown. Was it a planned restart for an update (Event ID 1074), or an unexpected crash (Event ID 41)?
This level of detail is invaluable for troubleshooting. It’s like being a detective, using the uptime data as your first clue to uncover the root cause of system instability. For development teams, maintaining stable environments is crucial. Unplanned downtime can disrupt workflows and delay projects, which is why it's so important to avoid common problems, sometimes called code smells that hinder development.
By using uptime data effectively, you turn a simple metric into a powerful tool for maintaining system health.
Got Questions About Windows Uptime?
So, you've learned a few ways to check how long your Windows machine has been running. You might still have a few lingering questions, though. Let's tackle some of the most common ones that pop up.
A big one is whether sleep or hibernation mode resets the clock. The short answer is no. When your PC takes a nap, it saves the current session—either in memory (sleep) or on your hard drive (hibernate). The uptime counter only resets when you do a full shutdown or restart. This is why the uptime on a laptop you just close the lid on can seem ridiculously high.
But what if the uptime number just looks flat-out wrong?
Why Does My System Uptime Seem Incorrect?
If you're staring at an uptime figure that doesn't make sense, there's a good chance Windows' Fast Startup feature is the culprit. It’s on by default in most modern Windows versions and creates a kind of hybrid shutdown that doesn't fully close out the core system session. The result? The uptime counter keeps on ticking.
If you're troubleshooting and need a reliable uptime reading, disabling Fast Startup is the way to go. You can find it in your power settings, and turning it off ensures every shutdown is a true, complete shutdown.
Sometimes, a system crash that avoids a proper shutdown can also throw the counter off. If you're hitting persistent issues or have more technical questions, you can always dig deeper in our comprehensive help documentation.
How Often Should I Bother Checking Uptime?
Honestly, you don't need to obsess over it on your personal machine. It's a diagnostic tool, not a daily metric. The best times to check are:
- When your PC feels sluggish: A long uptime is often a sign that a simple reboot could clear things up and restore performance.
- After installing updates or drivers: A quick check of the boot time is a great way to confirm that a required restart actually happened.
- On critical systems like servers: For servers, regular uptime checks (or, even better, automated monitoring) are crucial for spotting unexpected reboots and maintaining stability.
At the end of the day, knowing how to check uptime on Windows is a simple but powerful skill to have in your back pocket for keeping your system healthy and figuring out what's going on when things get weird.
Accelerate your team's code review process and reduce notification fatigue with PullNotifier. Get real-time, consolidated GitHub updates directly in Slack and keep your development cycle moving.