- Published on
A Guide to Engineering Key Performance Indicators
- Authors

- Name
- Gabriel
- @gabriel__xyz
Engineering key performance indicators (KPIs) are the numbers you track to see how your software development team is really doing. Think of them as objective insights that cut through the noise, showing you everything from delivery speed and code quality to team health. They help you spot bottlenecks before they become roadblocks and give you concrete reasons to celebrate wins.
What Are Engineering KPIs

Imagine trying to guide your engineering organization without a clear view of what's happening. It's like driving a car with no speedometer or fuel gauge—you're basically just guessing. Engineering KPIs are your team's dashboard, giving you clear signals on speed, quality, and overall health.
Crucially, these metrics should be seen as navigational tools, not surveillance cameras. Their job is to provide a clear, data-driven view of how well your team is performing against its goals. When you pick the right ones, the conversation shifts from tracking busywork (like lines of code) to focusing on meaningful outcomes and business impact. That shift is the bedrock of a healthy, high-performing engineering culture.
Moving Beyond Simple Metrics
Modern engineering key performance indicators aren't just about counting stuff. They’re about understanding the flow of your entire software development lifecycle. Good KPIs help you ask—and answer—the questions that lead to real improvements.
*   Are we shipping value to customers quickly and consistently?
*   Is the quality of our code getting better or worse over time?
*   Where are the biggest friction points in our development process?
*   Is our team showing signs of burnout?
By focusing on these areas, you create an environment where continuous improvement is the norm. The idea isn't to track every metric under the sun, but to measure the right things consistently. This approach empowers teams to understand their own performance and take ownership of their processes.
The most effective KPIs are the ones that spark curiosity and conversation, not fear or competition. They should be used to ask better questions—like "Why is our PR review time creeping up?"—rather than to assign blame.
The True Purpose of Measurement
At the end of the day, tracking engineering KPIs is all about connecting your team's daily work to the bigger business objectives. When an engineer can see how their latest pull request contributes to a lower Change Failure Rate, they understand their direct impact on product stability. That connection between action and outcome is incredibly motivating.
With a thoughtful KPI strategy, you give your leaders and teams the visibility they need to make smart, informed decisions. This data-driven approach replaces guesswork with clarity, letting you proactively tackle challenges and scale your engineering practice with confidence. It's about building a system where improvement is just a natural part of how you work.
Why Traditional Engineering Metrics Are Obsolete
In the not-so-distant past, engineering leaders had a pretty straightforward way of measuring productivity: they counted things. Metrics like lines of code (LOC), the number of commits, or even the hours someone spent at their desk were seen as direct reflections of an engineer's output. The logic felt simple—more activity must mean more progress, right?
But this approach is fundamentally broken for modern software development. It ends up rewarding all the wrong behaviors, championing busy work over actual, valuable work. Think about it: one engineer could churn out 1,000 lines of bloated, inefficient code, while another solves the same problem with 50 elegant, maintainable lines. In the old world, the first engineer looks like the star performer.
This style of measurement doesn't just miss the mark; it breeds a culture of mistrust. It turns metrics into a surveillance tool instead of a compass for improvement. It completely ignores the real heart of engineering effectiveness: creative problem-solving, deep collaboration, and, most importantly, delivering something of value to a customer.
The Shift from Activity to Outcomes
Today’s software world is all about complexity and collaboration. Success isn't about one person’s solo output anymore. It’s about how well a team works together to build, ship, and maintain reliable systems that solve real problems for real people.
And this is where those legacy metrics just fall apart. They can't tell you anything about the quality of a code review, the impact of a senior dev mentoring a junior, or the brilliance behind a scalable system architecture. Focusing on individual activity is like judging a chef by how many vegetables they chop instead of by the meal they serve.
A focus on outcomes over output is the single most important shift an engineering organization can make. It moves the conversation from "How busy are we?" to "Are we making a difference?" This change fosters autonomy, encourages innovation, and aligns engineering efforts directly with business goals.
The Impact of Modern Tools
On top of all this, the explosion of powerful new tools has made activity-based metrics even more meaningless. AI-powered coding assistants can spit out thousands of lines of boilerplate code in seconds, making LOC an almost laughable way to measure effort or value. What matters now isn’t who can type the fastest, but who can think the most critically and use these tools to solve tough challenges.
The industry is waking up to this new reality. The rise of AI has forced a major rethink of what productivity even means, with around 50% of organizations now adopting platform engineering to get products out the door faster. The best engineering teams have moved on, focusing on more meaningful signals like time to value, collaboration quality, and problem-solving skills. You can explore more about the future of engineering metrics to see just how deep this shift goes.
This evolution isn’t just a trend; it's critical for survival. To stay competitive, engineering leaders have to ditch the old vanity metrics and embrace a more sophisticated view of performance. The goal isn't just to build software, but to build the right software, effectively. And that requires a whole new set of engineering key performance indicators.
The Core Categories of Modern Engineering KPIs
To get a real sense of your engineering team's performance, you need a balanced diet of metrics. If you only track speed, quality will suffer. If you only track quality, delivery grinds to a halt. The best approach is to group your KPIs into categories that give you a complete, 360-degree view of your team’s health.
This method stops you from accidentally improving one area at the expense of another. Instead of chasing a single, often misleading number, you get a dashboard that tells the full story about your team's delivery, quality, and overall impact. These categories are the pillars of a measurement strategy that actually drives improvement.
To help you get started, here's a table that breaks down the essential KPI categories and some key metrics for each.
Essential Engineering KPI Categories and Metrics
This table outlines the crucial categories for a balanced engineering measurement strategy, with specific examples of KPIs for each area.
| KPI Category | What It Measures | Example KPIs |
|---|---|---|
| Delivery Velocity | How efficiently the team ships value, from code commit to production. | • Lead Time for Changes • Deployment Frequency • Cycle Time |
| System Quality & Reliability | The stability and resilience of the software in production. | • Change Failure Rate (CFR) • Mean Time to Recovery (MTTR) • Bug Rate |
| Team Productivity & Health | The team's workflow efficiency, collaboration, and sustainability. | • Code Churn/Rework Rate • Review Time • Developer Satisfaction |
| Business Impact | How engineering work contributes to organizational goals. | • Feature Adoption Rate • Customer Satisfaction (CSAT) • Revenue Impact |
This balanced approach ensures you're not just measuring output, but also the quality of that output and the health of the team producing it. Let's dive a bit deeper into some of these categories.
Delivery Velocity Metrics
This is all about a simple question: how fast and predictably can your team get value into the hands of users? It’s not just about raw speed but about the entire flow of work. These metrics are great for shining a light on bottlenecks in your development lifecycle, from the first line of code to the final deployment.
The undisputed champs in this category are the DORA metrics, which have become the gold standard for measuring how elite software teams perform.
*   **Lead Time for Changes**: This is the clock-timer for your delivery process. It measures the time from a code commit all the way to a successful production deployment. A short lead time means you have a nimble, responsive development process.
*   **Deployment Frequency**: A simple but powerful metric that tracks how often your team pushes code to production. High-performing teams often deploy multiple times a day, not just once every few weeks.
*   **Cycle Time**: While it sounds a lot like Lead Time, Cycle Time usually focuses on a smaller slice of the process—from the moment work *starts* on a task to when it's considered *done*. Our guide has some great tips on this, offering [7 proven strategies to reduce cycle time in 2025](https://blog.pullnotifier.com/blog/7-proven-strategies-to-reduce-cycle-time-in-2025).
If you want to dig deeper into DORA, check out this a practical guide on reducing software development costs using DORA metrics.
System Quality and Reliability
Shipping fast doesn't mean much if the product is always breaking. KPIs in this category track the stability and resilience of your software after it’s out in the wild. These metrics help you see the real impact of your changes and make sure that speed isn’t costing you customer trust.
High-quality systems are the foundation of a great user experience and a sustainable engineering pace. Tracking reliability isn't just about preventing bugs; it's about building a product that customers can depend on.
A couple of key metrics for quality and reliability stand out:
*   **Change Failure Rate (CFR)**: This one is straightforward. It's the percentage of your deployments that cause a production failure and require a hotfix or rollback. A low CFR is a huge vote of confidence in your delivery process.
*   **Mean Time to Recovery (MTTR)**: Failures are inevitable. When they happen, this metric measures how long it takes to get things back to normal. A low MTTR shows your team can react and resolve incidents quickly and effectively.
Team Productivity and Health
At the end of the day, engineering is all about people. This final category looks past the code and systems to measure the health, sustainability, and productivity of your team itself. These metrics are crucial for spotting early signs of burnout, frustrating process friction, or roadblocks in collaboration.
The scope of what we call Engineering Key Performance Indicators has really grown. It now covers everything from pure efficiency to team well-being, showing a deeper understanding that you can't just boil performance down to one number. You need a holistic view.
How to Select and Measure the Right KPIs
Choosing the right engineering key performance indicators isn't a one-size-fits-all game. If you just copy a popular list of metrics off the internet, you're more likely to track noise than a clear signal. The best way to do it is to work backward from what your team is actually trying to accomplish.
Start with one simple, powerful question: "What outcome are we trying to achieve?"
Maybe you want to crush production incidents, ship features faster, or make the system more stable. Whatever it is, that objective becomes your North Star. Once that's crystal clear, you can pick the KPIs that directly show whether you're making progress.
This diagram shows how top-level goals like Velocity, Quality, and Productivity are the foundation for picking specific, meaningful metrics.
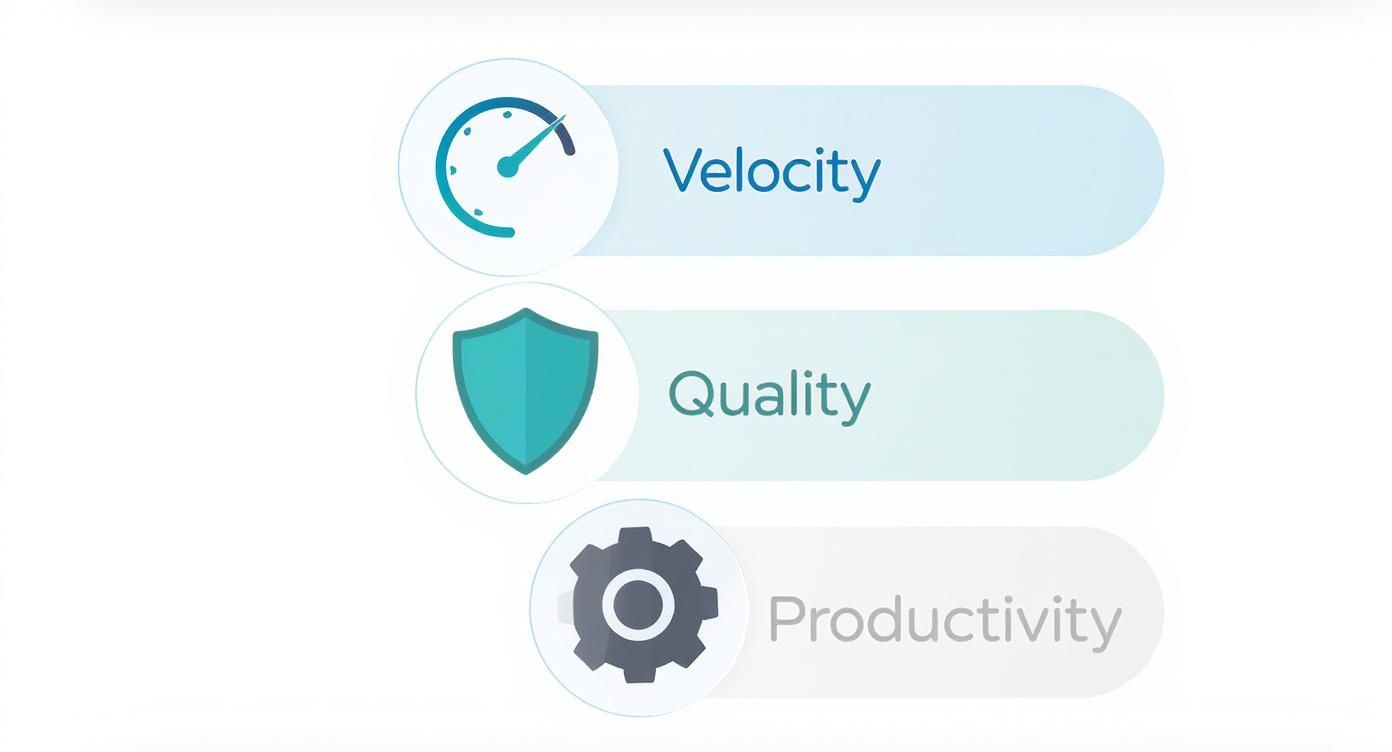
As you can see, a balanced strategy means looking at metrics across these different-but-connected categories. That's how you get the full picture of your team's performance.
From Manual Tracking to Automated Insights
Not too long ago, measuring KPIs was a miserable, manual chore. Managers would spend hours pulling data from different systems, a process that was not only a massive time-sink but also full of errors.
Thankfully, those days are over. The key to successful measurement today is automation. Modern analytics tools plug directly into your dev stack (think Jira and GitHub) and pull all the data for you.
This isn't just about saving time; it's about getting things right. Automation drastically improves accuracy and kills the human error that used to plague tracking for things like DORA metrics, lead time, and deployment frequency. In a competitive world, acting on real-time insights is a massive advantage.
Communicating the "Why" Behind Your KPIs
Once you've picked your metrics, the last—and most important—step is talking to your team about them. The idea here is to get buy-in, not to make everyone feel like they're under a microscope.
Metrics should be tools for empowerment and continuous improvement, not instruments for judgment. When engineers understand the 'why' behind a KPI, they see it as a shared goal rather than a top-down mandate.
A transparent process builds trust and gets everyone on the same page. Here’s a simple way to roll out new KPIs:
*   **Explain the Goal First:** Start with the team objective. For example, "We want to reduce the number of bugs hitting our users."
*   **Introduce the Metric:** Then, connect the KPI directly to that goal. "Tracking **Change Failure Rate** will show us if our new quality checks are actually working."
*   **Make it Collaborative:** Get the team involved in setting realistic benchmarks and go over the data together in retrospectives.
By taking this approach, you create a measurement system that actually drives improvement and makes your engineering culture stronger. If you want to dive deeper, check out our guide to engineering productivity measurement.
Using Your KPI Dashboard to Drive Improvements

So you’ve started collecting data. That’s step one. But raw numbers are just noise—they don't tell you much on their own. The real magic happens when you turn that noise into a clear story about your team's performance, and a good KPI dashboard is the ultimate storyteller.
A great dashboard doesn't just spit numbers back at you. It brings them to life with clean visualizations, letting you spot trends at a glance. You shouldn’t just see this week's Cycle Time; you should see how it’s been trending over the last quarter. Context is king.
Turning Data into Actionable Insights
The best KPI dashboards let you drill down into the details. Think of it like a doctor diagnosing an illness. A high-level metric, like a fever, just tells you something is wrong. The real work starts with the follow-up tests that help you pinpoint the cause.
Your dashboard should work the exact same way. When you see a metric heading in the wrong direction, you need the tools to ask "why?" and get a real answer.
A dashboard isn’t a report card; it’s a diagnostic tool. Its purpose is to spark curiosity and guide your investigation, helping you move from observing a problem to understanding its root cause.
Let’s say your dashboard shows that your team’s Cycle Time has slowly crept up by 15% over the last two months. On its own, that’s a red flag, but you can’t act on it. A good dashboard lets you dig in. With a few clicks, you might discover the entire increase is happening at the code review stage.
Diagnosing and Solving Real Problems
Now that is an insight you can work with. The problem isn't some vague "slowdown"—it's a specific bottleneck in your workflow. Pull Request Review Time is one of those critical metrics that often gets buried inside the overall Cycle Time, but long review delays can stall the entire pipeline and leave developers feeling stuck.
This is where you can connect the dots to a real solution. By using a tool like PullNotifier, you can tackle this exact problem head-on. It cuts through notification fatigue and pushes clear, real-time PR updates to Slack, making sure reviews get the attention they need without developers having to constantly check GitHub. This directly shrinks the review cycle, which in turn lowers your overall Cycle Time.
This whole process shows the real power of engineering key performance indicators when you pair them with the right tools. We dig into this even more in our post on key metrics for faster code reviews in GitHub. By tracing a high-level trend back to a specific, solvable process issue, you turn abstract numbers into real actions that improve how your team works. Your dashboard stops being a static report and becomes a catalyst for genuine, continuous improvement.
Common Pitfalls to Avoid with Engineering KPIs
Bringing engineering KPIs into your workflow can feel like a huge leap forward, but with great power comes great responsibility. When you get it wrong, even the most well-intentioned metrics can breed a culture of fear, wreck team morale, and actually encourage the exact opposite of what you want.
The golden rule? Use KPIs as a flashlight, not a hammer.
Weaponizing Metrics Against Individuals
This is the fastest way to kill trust. Let's say an engineer's Change Failure Rate spikes one week. The absolute worst thing you can do is point a finger and assign blame. That instantly turns a potential learning moment into a punishment, and you can bet your team will stop taking risks or being transparent about mistakes.
Instead, that spike should be a conversation starter—about the system, not the person.
A sudden jump in a metric like Change Failure Rate isn’t a sign of individual failure. It’s a signal from your system that something needs attention. Maybe your testing environment is lagging, or a certain part of the codebase has become a minefield of complexity.
Focusing on Outputs Instead of Outcomes
It’s easy to fall into the trap of chasing vanity metrics while completely ignoring what actually matters. Celebrating a high deployment frequency is pointless if those deployments are riddled with bugs or ship features nobody asked for. You end up with a team that’s just "shipping for shipping's sake."
And please, don't compare teams based on raw numbers. Things like story points are useful for a team's internal planning, but they're a terrible tool for comparison.
*   **Pitfall:** Team A closed **50 story points** and Team B only closed **30**, so Team A must be "better."
*   **Reality:** Team B might be neck-deep in a gnarly refactoring project that will deliver massive long-term value, while Team A is just cranking out simple UI tweaks. The points aren't even in the same universe of value.
The Problem with Context-Free Comparisons
Metrics without context are just noise. A team wrestling with a decade-old legacy monolith will have a completely different performance profile than a team building a shiny new microservice from the ground up. Applying the same benchmarks to both is unfair and, frankly, useless. It won’t give you any real insights.
Always treat engineering key performance indicators as tools for understanding your unique team and system. They should spark curiosity, not judgment. When you focus on trends over time and use data to ask better questions, you build a measurement program that helps everyone get better, together.
When you start talking about engineering KPIs, a few common questions always pop up—usually about the people, not just the code. Let's get into the ones I hear most often.
How Do I Get My Team on Board?
Here’s the secret: don't spring a new dashboard on your team and call it a day. Real buy-in comes from building it with them, not for them.
Start the conversation with shared goals, like "how can we cut down on bugs hitting production?" Then, work together to pick the KPIs that actually track progress toward that goal. When engineers have a hand in choosing the metrics, they stop seeing them as a report card from management and start seeing them as tools to make their own work better.
How Often Should We Review Our KPIs?
KPIs aren't a "set it and forget it" kind of thing. To be useful, you have to look at them regularly.
A great place to start is during your team's retrospectives, maybe every two weeks. Folding KPI discussions into your existing meetings makes it a natural part of your improvement cycle, not another pointless meeting on the calendar. This keeps the data fresh and the conversation going.
Now for the most sensitive question of all: individual performance. Let me be crystal clear: never use team or system-level KPIs for individual performance reviews. KPIs are there to show you the health of the system and the team, not to rank engineers. The moment you do, you destroy trust and all you'll get is people gaming the numbers.
Ready to turn those KPI insights into real action? PullNotifier cuts down on code review delays by surfacing PR-related KPIs and sending smart notifications right to Slack. See how it works at https://pullnotifier.com.