- Published on
A Practical Guide to Key Performance Indicators Software Development
- Authors

- Name
- Gabriel
- @gabriel__xyz
Think of software development KPIs as the gauges on a high-performance car's dashboard. You can feel the speed, sure, but without data on fuel, engine temp, and tire pressure, you're just driving blind. Sooner or later, you're going to run into trouble.
What Are Software Development KPIs and Why They Matter
Key Performance Indicators (KPIs) are that critical dashboard for your engineering team. They give you a clear, data-driven window into how effectively your team is shipping value.
These metrics offer real-time insights into your delivery process, system stability, and even team health. The goal isn't just about moving faster; it's about building a sustainable, high-quality engine for software delivery. By tracking the right numbers, teams can spot bottlenecks before they become roadblocks, make decisions based on facts instead of feelings, and connect their day-to-day work directly to what the business actually cares about.
Beyond Speed: A Holistic View of Performance
Good KPIs give you a balanced look at performance, moving way beyond simplistic counts like lines of code or tickets closed. Instead, they help you answer the questions that really matter:
*   **How fast can we deliver value?** Metrics like **Cycle Time** measure the entire journey from a fresh idea to live code in production.
*   **How stable is our product?** **Change Failure Rate** tells you how often your deployments break things.
*   **How quickly can we recover?** **Mean Time to Recovery (MTTR)** is all about gauging your team's resilience when things inevitably go wrong.
*   **Are our processes efficient?** **Pull Request (PR) lifecycle metrics** expose friction and slowdowns in your code review process.
This big-picture view is essential. The application development software market was valued at 1,450.87 billion by 2031. That kind of growth demands sharp management, and KPIs provide the framework you need to handle the complexity and scale your delivery. To get a better sense of this explosion, you can see more software industry growth statistics here.
KPIs are tools for empowerment, not micromanagement. They give teams the visibility they need to own and improve their own workflows, fostering a culture of continuous improvement and accountability.
From Subjective Feelings to Objective Facts
Ultimately, using software development KPIs changes the conversation from "I feel like..." to "The data shows...". Instead of saying, "It feels like code reviews are slow," you can now say, "Our average PR review time has jumped 15% this quarter." That kind of clarity is a game-changer. It empowers teams to zero in on specific problems and actually measure whether their solutions are working.
This data-first approach is the bedrock of understanding and improving what your team can achieve. For a deeper dive, check out our guide to engineering productivity measurement. When you get them right, KPIs become the foundation for a healthy, high-performing engineering culture.
What Are the Most Valuable Engineering Metrics to Track?
With dozens of potential metrics out there, it’s easy to get lost in the noise. The trick is to focus on the handful that give you the clearest signal on how healthy and efficient your development process really is. To cut through the clutter, we can start with the industry standard for measuring software delivery performance.
And it’s a big deal. The global software market is exploding, projected to grow from 1.45 trillion by 2031.
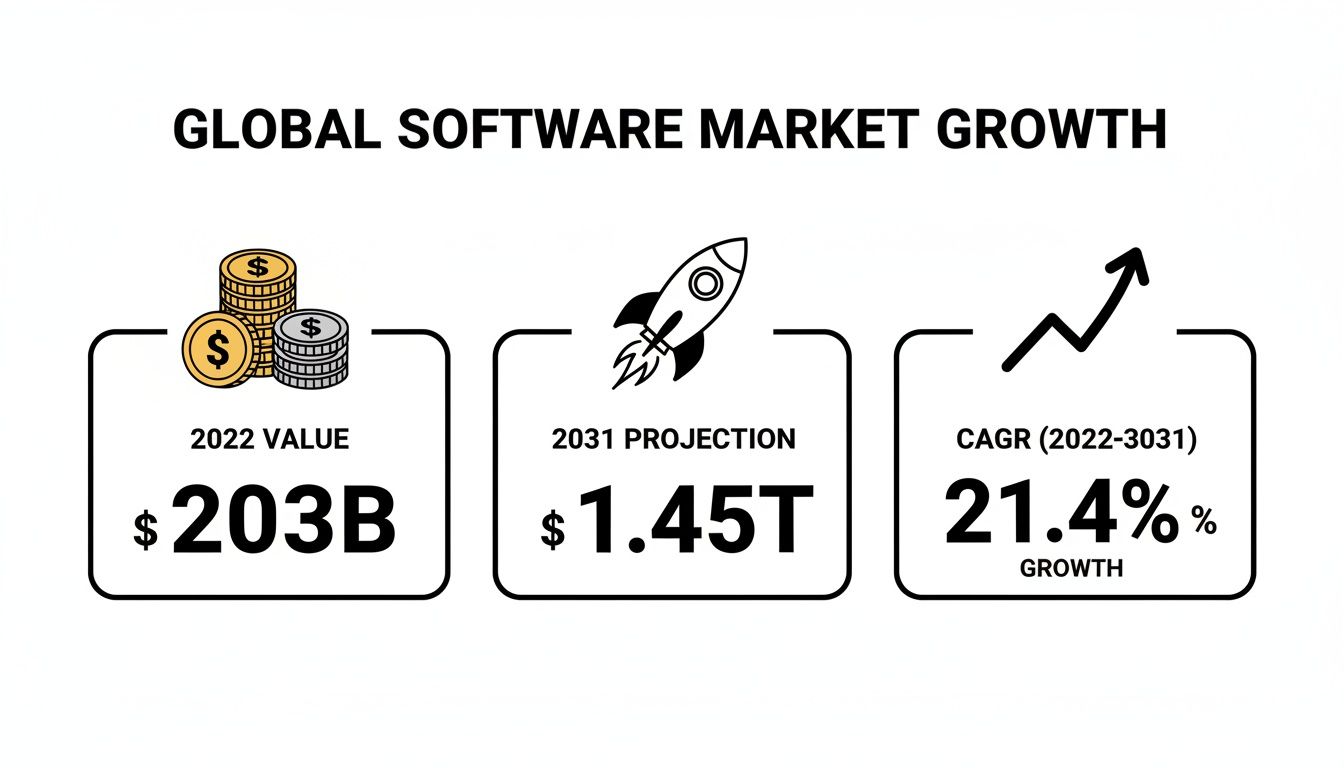
This kind of growth is exactly why top engineering teams rely on sharp, insightful metrics to manage complexity and stay ahead.
The Foundation: DORA Metrics
The DORA metrics have become the gold standard for a reason. Born from years of rigorous research by Google's DevOps Research and Assessment (DORA) team, these four metrics give you a balanced, objective view of performance that ties directly to business outcomes.
Think about it this way: elite teams can restore service in under an hour after an incident, while low performers might take a full day or more. That difference has a massive impact on revenue and customer trust.
The four key DORA metrics are:
*   **Deployment Frequency:** How often do you ship code to production? This is all about speed and throughput.
*   **Lead Time for Changes:** How long does it take for a committed piece of code to make it into production? This measures your end-to-end efficiency.
*   **Change Failure Rate:** What percentage of your deployments cause a production failure? A critical measure of quality and stability.
*   **Mean Time to Recovery (MTTR):** How long does it take to get back online after a production failure? This tells you how resilient your team is.
One of the most common mistakes is chasing speed (Deployment Frequency) while ignoring quality (Change Failure Rate). Elite teams prove you don’t have to choose. They move fast without breaking things, showing that speed and stability can—and should—go hand-in-hand.
Here’s a quick table to bring these core software development KPIs together. It summarizes what each metric measures, how to calculate it, and what the best in the business are achieving.
Key Software Development KPIs Explained
| Metric | What It Measures | Formula / Calculation | Elite Performer Benchmark |
|---|---|---|---|
| Deployment Frequency | The team's delivery pace and throughput. | Total number of deployments / Time period | Daily or on-demand |
| Lead Time for Changes | End-to-end delivery speed from commit to production. | Time from first commit to successful deployment | Less than 1 day |
| Change Failure Rate | The quality and stability of releases. | (Number of failed deployments / Total deployments) x 100 | Less than 15% |
| Mean Time to Recovery (MTTR) | The team's ability to recover from production failures. | Total downtime / Number of incidents | Less than 1 hour |
These benchmarks, defined by the DORA team, aren't just arbitrary numbers; they're markers of high-performing organizations that consistently deliver value and maintain stable systems.
Going Deeper: Cycle Time and its Phases
While Lead Time for Changes is a great high-level view, Cycle Time gives you a more granular perspective that teams can actually act on. It tracks the time from the first commit on a branch to its deployment.
The real magic happens when you break Cycle Time down into its individual phases. This is where you find the hidden bottlenecks.
- Coding Time: The time from the first commit until a Pull Request (PR) is opened. If this is long, it might point to unclear requirements or overly complex tasks.
- Pickup Time: The time a PR sits idle before a reviewer makes the first comment. This is often just "dead time" where work is stalled.
- Review Time: The active phase from the first comment until the PR is approved and ready to merge.
- Deploy Time: The time from merging a PR to releasing it into production.
By tracking each phase, you can pinpoint exactly where things are slowing down. Are your developers coding quickly but reviews are dragging? Or is your review process lightning-fast, but deployments are a manual, painful slog? This breakdown transforms a vague feeling of "we're too slow" into a specific, solvable problem.
The Heart of the Workflow: Pull Request Metrics
In modern software development, the Pull Request is where collaboration happens. The efficiency of your PR workflow has a huge ripple effect on your overall Cycle Time and, just as importantly, your team's morale.
A few key PR-centric metrics to watch are:
*   **PR Size:** Usually measured in lines of code changed. Smaller PRs (**under 100 lines of code**) are almost always reviewed faster and are less likely to introduce bugs.
*   **Review Iterations:** How many back-and-forth cycles happen between the author and reviewer? A high number of iterations can signal unclear acceptance criteria or a need for better code quality upfront.
*   **PR Review Time:** The total time a PR spends in the review phase. This is a massive factor in developer productivity and happiness.
Optimizing this part of your process can deliver huge returns. A slow review process doesn’t just delay features; it forces developers into constant context switching, which kills focus and drains motivation. Digging into key metrics for faster code reviews can give you targeted ways to shrink this common bottleneck.
Beyond the Pipeline: Code Churn and Financial Metrics
Valuable engineering metrics aren't just about the delivery pipeline. Two other areas give you crucial context on team performance and how it aligns with the business.
Code Churn measures how much code is rewritten or deleted shortly after it’s committed, usually within a few weeks. A high churn rate can be a big red flag, suggesting things like:
*   Requirements were fuzzy or changed on the fly.
*   The first pass at the code was rushed or low-quality.
*   The code was too complex, making it hard to build on correctly.
Some churn is normal, but if the rate is consistently high, it’s worth looking at your planning and QA processes. It’s a powerful sign of wasted effort.
Finally, financial efficiency is becoming a core engineering concern. With infrastructure now living in the cloud, engineering decisions can have an immediate impact on the company’s bottom line. Understanding and applying effective FinOps best practices for optimizing cloud spend is no longer just a job for the finance team. It's a key responsibility for engineering leaders who want to build sustainable and efficient systems.
How to Choose the Right KPIs for Your Team
Picking the right key performance indicators for your software team isn’t like choosing from a menu. It’s more like a doctor writing a specific prescription—what works for one patient won’t necessarily work for another. Every team is unique, and the best metrics are the ones that perfectly match your team's context, goals, and maturity level.
There’s simply no universal "best" set of KPIs. A startup sprinting to find product-market fit will naturally be obsessed with speed and iteration. For them, metrics like Deployment Frequency and Cycle Time are vital signs, telling them how fast they can ship ideas and get them in front of real users.
On the other hand, an enterprise team managing a critical financial system is playing a completely different game. Their world revolves around stability and reliability, making Change Failure Rate and Mean Time to Recovery (MTTR) their most important gauges. Picking the wrong metrics here isn't just ineffective; it can be outright dangerous.
Align KPIs with Team Maturity and Goals
A software team’s journey has different stages, and your metrics need to evolve right alongside it. A brand-new team might just focus on building a baseline and creating a predictable workflow. As they mature, that focus can shift to optimizing that flow and, eventually, to innovation.
Think about these common scenarios:
*   **Early-Stage Startup:** The goal is pure speed and learning. You’ll want to prioritize delivery metrics like **Lead Time for Changes** and **Deployment Frequency**. The entire mission is to ship, get feedback, and iterate as quickly as humanly possible.
*   **Scaling Growth Company:** As the user base expands, stability suddenly becomes a huge deal. Speed is still important, but you have to start layering in quality metrics like **Change Failure Rate** and bug counts to make sure that growth is actually sustainable.
*   **Mature Enterprise:** Here, the focus is on reliability, security, and efficiency at a massive scale. Metrics like **MTTR** and system uptime are non-negotiable, often paired with efficiency indicators that keep an eye on development costs.
Your project goals also shape your KPI choices. A feature-driven project will have a different dashboard than a sprint dedicated to paying down technical debt. For a deeper look at identifying the one metric that matters most for your product, check out this guide on defining a crucial North Star Metric.
Create a Balanced Diet of Metrics
Focusing on a single KPI is a classic trap. If you only measure Deployment Frequency, you might accidentally encourage teams to ship code recklessly, sending your Change Failure Rate through the roof. That’s why you need a balanced "diet" of metrics that covers speed, quality, and team health.
A healthy KPI framework gives you a holistic view. It should tell you not just how fast you're going, but also how well the engine is running and if the drivers are burning out. Neglecting any one area leads to an unsustainable system.
This balanced approach must always include the human element. Developer satisfaction and experience metrics are finally being recognized as critical KPIs, and for good reason—they have a direct impact on velocity, retention, and product quality. Research shows that happy, engaged developers don't just stick around longer; they write better software. In fact, organizations that measure developer experience found that teams struggling with high-friction workflows had a 30-40% lower delivery velocity.
Tailor KPIs to Different Roles
Finally, remember that different people in your organization need to see different views of the data. The metrics a Tech Lead obsesses over are far more granular than what an Engineering Manager will present to leadership.
Here’s a simple way to break it down:
*   **Developers:** Need to focus on workflow metrics they can directly influence. Things like **PR Cycle Time**, **Review Time**, and **PR Size** help them and their peers spot and fix bottlenecks in their day-to-day work.
*   **Tech Leads:** Are responsible for monitoring code quality and process health. Metrics like **Code Churn**, **Review Iterations**, and **Bug Density** are invaluable for upholding technical standards.
*   **Engineering Managers:** Track team-level performance and health. They look at trends in **Cycle Time**, **Deployment Frequency**, and developer satisfaction to guide team strategy and report up the chain.
When you tailor your KPIs to each team’s context, goals, and roles, they stop being a boring reporting exercise. They become a powerful tool for driving real, sustainable improvement.
Building a Practical KPI Tracking System
Picking the right KPIs is just the start. The real magic happens when you make them a visible, living part of your team’s culture. That means ditching the manual spreadsheets and building a system that delivers trustworthy data without creating a bunch of extra work.
The goal here is to establish a single source of truth. You need one place where everyone, from a junior dev to the CTO, sees the exact same numbers. This builds trust and puts an end to those frustrating debates over whose data is "correct." Whether you invest in an engineering intelligence platform or roll your own dashboards with tools like Grafana, consistency is everything.

Dashboards Aren't One-Size-Fits-All
A single, cluttered dashboard that tries to be everything to everyone usually ends up being useful to no one. The trick is to create tailored views for different roles, making sure the information is relevant and actionable for the person looking at it.
*   **For the Executive Team:** This needs to be a high-level summary that connects engineering effort to business impact. Think long-term trends in DORA metrics, cycle time tied to strategic projects, and how the team is tracking against quarterly goals. It should answer the question, "Are we delivering value reliably and efficiently?"
*   **For Team Leads:** This view is more operational and focused on the health of the workflow. It should track weekly trends in things like PR cycle time, review bottlenecks, and work-in-progress (WIP) limits. It’s a tool to help leads spot friction points and guide better conversations in retrospectives.
*   **For Individual Developers:** This isn't about judgment; it's a tool for self-improvement. It could be something as simple as real-time feedback on PR size or a gentle nudge when a PR has been sitting in review for too long. The idea is to empower developers to unblock their own work.
A great KPI dashboard shouldn't just present data; it should spark curiosity. The best ones make you ask questions like, "Why did our cycle time spike last week?" or "What's really causing that delay in our review process?" That's where real improvement begins.
Weave Metrics into Your Daily Rhythm
The most effective tracking systems don't feel like a separate task. They're woven directly into your team's existing routines. When metrics become a natural part of the conversation, they stop being a reporting chore and start being a powerful tool for getting better every day.
This means bringing the data to where the team already is. Instead of forcing everyone to log into yet another dashboard, you can pipe alerts and summaries directly into the team’s Slack channel.
Making Metrics Part of the Conversation
To truly bake KPIs into your culture, you have to talk about them. Regularly. Making the data a recurring topic in your team ceremonies creates a tight feedback loop that actually drives progress.
Here are a few simple ways to do this:
- Daily Stand-ups: Briefly call out any blocked PRs or immediate bottlenecks the metrics are flagging.
- Sprint Retrospectives: Use trend data from the last sprint to ground the discussion. Instead of just going on feelings, you can point to a chart showing review times slowed down and ask, "What happened here, and how can we avoid it next time?"
- Planning Meetings: Look at historical data on things like planning accuracy and cycle time to make much more realistic forecasts for the next sprint.
By making key performance indicators in software development a regular, collaborative talking point, you turn them from abstract numbers into a shared language for improvement. This fosters a culture of ownership where the entire team is aligned on what success looks like and how to get there together.
Improving Your PR Workflow with PullNotifier
Knowing your software development KPIs is half the battle. Actually improving them? That takes focused action. More often than not, the pull request process is a black hole of hidden delays, a place where idle time can quietly balloon your overall Cycle Time. This is exactly where a specialized tool can turn KPI theory into real-world results.
A slow review process does more than just delay a feature release—it kills your team's momentum. A pull request that's just sitting there is a classic bottleneck, forcing developers to switch context while they wait for feedback. That waiting game is a direct hit to both productivity and morale.

From Waiting Games to Real-Time Action
Think about the typical PR lifecycle for a moment. A developer pushes up some code and drops a link into a busy Slack channel. Within minutes, it's buried under a mountain of other messages. Hours can go by before a reviewer even lays eyes on it. That initial delay, what we call Pickup Time, is pure waste.
This is the exact problem tools like PullNotifier were built to solve. Instead of relying on manual pings or drowning in noisy, generic notifications, it connects GitHub directly to Slack with smart, real-time updates that cut through the chatter.
By sending a clean, consolidated summary of a new PR—including its size, status, and requested reviewers—directly to the right people in the right channel, PullNotifier gets the right eyes on it, fast. It automatically nudges the reviewers, turning that dead waiting time into active review time. This one change can slash your PR Pickup Time, which in turn shrinks your overall PR Review Time. For any team serious about boosting its engineering velocity, these are the improvements that matter.
The core idea is simple but powerful: turn communication friction into workflow acceleration. When PRs are instantly visible and actionable, the entire development cycle speeds up.
A Before-and-After Scenario
Let's walk through a practical example to see how this actually impacts your key performance indicators for software development.
*   **Before PullNotifier:** A team's average PR Pickup Time is a painful **4 hours**. Reviewers frequently miss notifications in crowded channels, so PRs often sit untouched for half the day. This lag contributes to a bloated average Cycle Time of **72 hours**.
*   **After PullNotifier:** With automated, targeted Slack notifications, the average PR Pickup Time plummets to just **30 minutes**. Reviewers are pinged instantly and can jump on it right away. This directly shrinks the PR Review Time and helps get the team's average Cycle Time down under **48 hours**—a **33% improvement**.
This isn't just about moving faster. It's about creating a more responsive and less frustrating environment for your developers. When you eliminate the "hurry up and wait" dynamic of code reviews, you empower your team to stay in the zone and ship code smoothly. For engineers who want to reclaim their focus, you can learn more about building a better workflow with PullNotifier's solutions for developers. It’s a perfect example of how a simple process tweak can lead to massive, measurable gains in your most important engineering metrics.
Common KPI Pitfalls and How to Avoid Them
Implementing KPIs is a powerful move, but it's loaded with traps. Get it wrong, and even the best intentions can turn metrics into something toxic—a source of fear that drives all the wrong behaviors. The goal is to light the way forward, not to punish people for where they are today.
One of the quickest ways to poison the well is by weaponizing metrics. This is what happens when you tie KPIs directly to a developer’s performance review or use them to create internal leaderboards. The moment a developer knows their bonus is tied to "story points completed," what do you think happens? They'll start gaming that number, often sacrificing quality and collaboration to do it.
This practice absolutely demolishes psychological safety. Instead of using data to spark curiosity and solve problems as a team, everyone gets defensive. The focus shifts from delivering real value to just making the numbers look good.
The Lure of Vanity Metrics
Another easy trap to fall into is chasing vanity metrics. These are the numbers that are a breeze to track and look fantastic on a chart, but they tell you absolutely nothing about performance or the value you're shipping. They give you a nice, warm feeling of productivity while being completely hollow.
The all-time classic is tracking lines of code (LOC). A developer could write 500 lines of bloated, messy code, while another could solve the same problem in 50 elegant lines. If you reward the former, you're actively encouraging a codebase that's a nightmare to maintain.
Other popular vanity metrics include:
*   **Number of commits:** This just encourages tiny, frequent commits over thoughtful, well-structured ones.
*   **Tickets closed:** Pushing this metric often leads to rushed work and a sky-high **Rework Rate**.
*   **Velocity or story points:** While these can be useful for a single team's planning, comparing them across teams is like comparing apples and oranges. It just creates unhealthy competition.
The most dangerous KPIs are the ones that measure activity instead of outcomes. A team can look incredibly busy—committing code, closing tickets, merging PRs—without actually delivering a single drop of value to the customer. Real performance is about impact, not just effort.
The Danger of Metric Myopia
Fixating on a single metric is another recipe for disaster. Call it metric myopia or tunnel vision, the result is the same. If you obsess over cranking up your Deployment Frequency but ignore your Change Failure Rate, you'll definitely ship code faster. You'll also be shipping a whole lot more bugs.
A balanced set of metrics is non-negotiable. You need counter-metrics that keep each other honest. Pair a speed metric with a quality metric. Track throughput right alongside stability. This is how you make sure you're improving the whole system, not just optimizing one piece at the expense of another.
Finally, there’s the trap of metric blindness. This is when you collect mountains of data but do absolutely nothing with it. Dashboards are built, reports are generated, but nobody uses the information to start a conversation or drive change. The data just sits there, collecting dust, while the team keeps running on gut feelings.
To sidestep these pitfalls, weave your metrics into the team's daily rhythm. Bring them up in retrospectives to guide the conversation, never to assign blame. When you build a culture where data is a tool for learning together, your KPIs will build trust, drive real improvement, and support a healthy, high-performing team.
Got Questions About Software Development KPIs?
Diving into the world of engineering metrics always brings up a few questions. Let's tackle some of the most common ones that engineering leaders and developers run into when they're just getting started.
How Often Should We Be Looking at Our KPIs?
The right cadence really depends on the metric and who's looking at it. For the day-to-day stuff, like PR cycle time, teams should have that data in real-time or, at the very least, chat about it daily in stand-ups.
For the bigger picture metrics, like the DORA metrics, a weekly review in team meetings is usually perfect. At the leadership level, you'll want to zoom out a bit—a monthly or quarterly review is great for spotting long-term trends and figuring out where the real strategic opportunities are.
Can We Use KPIs for Individual Performance Reviews?
This is a huge one, and the answer is a hard no. Tying key performance indicators in software development to individual performance is a classic anti-pattern. It’s the fastest way to encourage "gaming the system" and can absolutely wreck team morale and kill collaboration.
KPIs are at their best when they're a tool for understanding how the team and the system are performing. The goal is to drive collective improvement, not to rank or judge individual engineers.
What's the First KPI a New Team Should Track?
If you're just starting out, the best metric to begin with is Cycle Time. It's a fantastic, all-encompassing metric that measures your entire development process, from the very first commit all the way to seeing that code live in production.
Tracking Cycle Time gives you an immediate, end-to-end view of your workflow's speed and efficiency. More importantly, it shines a bright light on the biggest bottlenecks holding your team back, so you know exactly where to focus your improvement efforts first.
Stop letting pull requests get lost in the noise. PullNotifier provides real-time, consolidated GitHub updates directly in Slack, slashing review delays and accelerating your team's workflow. Start for free at PullNotifier.com.