- Published on
How to Check for Memory Leaks: A Developer's Guide
- Authors

- Name
- Gabriel
- @gabriel__xyz
Essentially, checking for a memory leak comes down to monitoring your app's resource usage over time, using profiling tools to compare memory snapshots, and combing through your code for common culprits like unclosed resources or forgotten event listeners. It’s a mix of observing application behavior and then diving deep into the code to find the root cause.
Why Memory Leaks Silently Wreck Your Application

Before we jump into the "how-to," let’s get clear on why this is such a big deal. Think of a memory leak as your application forgetting to clean up after itself. It grabs some memory to do a job but never puts it back, and over time, all that "forgotten" memory starts to pile up. This leads to a host of problems that are notoriously frustrating to diagnose.
The consequences aren't just technical; they hit the business where it hurts. I’ve seen a seemingly minor leak silently drag an application's performance down until it’s nearly unusable. Worse, they can cause those baffling, intermittent crashes that you can never seem to reproduce, leading to service outages and chipping away at user trust.
The Slow Creep of System Failure
A memory leak is rarely a sudden explosion. It’s more of a slow, creeping illness that gradually degrades your system's health. At first, you probably won’t even notice anything. Your application seems to be humming along just fine, but under the surface, its available memory is shrinking byte by byte.
This slow drain creates a ripple effect:
- Performance Degradation: As memory gets tight, the garbage collector has to work overtime, hogging precious CPU cycles that should be busy serving your users. Everything just gets... sluggish.
- Unexpected Crashes: Eventually, your app asks for more memory than the system can give, triggering a sudden out-of-memory (OOM) error that crashes the process without any warning.
- Ballooning Cloud Costs: In auto-scaling cloud environments, a memory leak can trick the system into provisioning more and more resources to compensate, leaving you with a shockingly large bill at the end of the month.
To get a better handle on what to look for, here’s a quick rundown of the common symptoms that should set off alarm bells.
Common Symptoms of a Memory Leak
| Symptom | What It Looks Like | Why It Happens |
|---|---|---|
| Gradual Performance Loss | Your application becomes slower and less responsive over time, especially after running for a while. | The garbage collector is working harder and more frequently, stealing CPU time from your application's main tasks. |
| Increasing Memory Usage | Monitoring tools show the application's memory footprint consistently growing without ever leveling off. | Objects are being allocated but are never released, so they accumulate in memory. |
| Frequent Crashes | The application suddenly terminates with an out-of-memory (OOM) error. | The application has consumed all available memory and the operating system has no choice but to kill the process. |
| High CPU Usage | You notice unexplained spikes in CPU activity that correlate with memory pressure. | This is often a side effect of the garbage collector running constantly in a desperate attempt to free up memory. |
These signs are your early warning system. Ignoring them is like ignoring a slow drip in the ceiling—it might seem small at first, but it will eventually cause major damage.
A memory leak is a quiet bug that does its damage over time. That's why proactive monitoring and regular code health checks are non-negotiable for keeping your application stable and reliable.
This isn't just a software problem, either. The global market for physical leak detection is projected to hit USD 5.65 billion by 2032, a testament to a universal truth: undetected leaks, whether memory or material, inevitably lead to costly system failures. You can read more about this analysis on DataBridge.
Ultimately, knowing how to find a memory leak is a fundamental skill for any developer. It shifts you from a reactive, "firefighting" mode to a proactive one where you’re building resilient and efficient software from the start. Using a solid code review checklist can even help you spot potential leaks before they ever make it into production.
Choosing the Right Memory Leak Detection Tool

Okay, you've spotted the symptoms of a memory leak. Now comes the hunt. The market is flooded with memory profiling tools, and picking one can feel like a shot in the dark. But here’s the secret: there's no single "best" tool. There's only the best tool for your specific stack and the problem you're trying to crack.
My first move is always to categorize tools by their environment and when they do their analysis. This simple filter cuts through the noise fast. You wouldn’t use a hammer to turn a screw, and the same logic applies here.
Matching Tools to Your Tech Stack
The most critical filter is your programming language and runtime. Each ecosystem has its own specialized profilers that are built to give you the most accurate, deeply integrated insights. Trying to force a generic tool to work usually ends in frustration and a pile of useless data.
Here’s a quick rundown of my go-to tools for common environments:
- For C/C++: Valgrind is the undisputed king. Its Memcheck tool is an absolute beast for sniffing out memory management bugs in native code, including leaks. It's incredibly thorough, but just be ready for a major performance hit while it runs.
- For Java/JVM: The Java world is packed with great options. I usually reach for VisualVM or JProfiler. Both give you detailed heap analysis, object allocation tracking, and snapshot comparisons, making it much easier to pinpoint which objects are piling up over time.
- For JavaScript (Browser/Node.js): Chrome DevTools is the first place any web developer should look. The Memory and Performance profilers are fantastic for taking heap snapshots and spotting detached DOM nodes—a classic source of leaks in single-page apps. For Node.js, the built-in tools work powerfully with the DevTools profiler for server-side analysis.
Choosing a tool designed for your stack is the single most important decision in this process. It means you get actionable data you can trace back to your code, not just generic metrics.
The goal isn't just to find a memory leak; it's to find your memory leak. A language-specific profiler connects the dots between a generic symptom like "high memory usage" and the specific line of code causing it.
Static vs. Dynamic Analysis Tools
Another key distinction is whether to use a static or dynamic analysis tool. Each has its own strengths, and honestly, they work best when you use them together as part of a complete quality strategy.
Static Analysis Tools: These tools scan your source code before you even run it. They're brilliant for catching potential problems based on known anti-patterns, like forgetting to close a file stream. Think of them as preventative medicine—they help you write cleaner, safer code from the get-go.
Dynamic Analysis Tools (Profilers): These tools watch your application while it's running. This is where you’ll spend most of your time when you're actively hunting a known leak, as they're essential for finding issues that only crop up under specific runtime conditions or after prolonged use.
Thinking about how leak detection fits into your team's broader software quality assurance processes can add valuable context. At the end of the day, combining proactive static analysis with reactive dynamic profiling gives you the best shot at building—and maintaining—a leak-free application.
Running Your First Memory Profiling Session
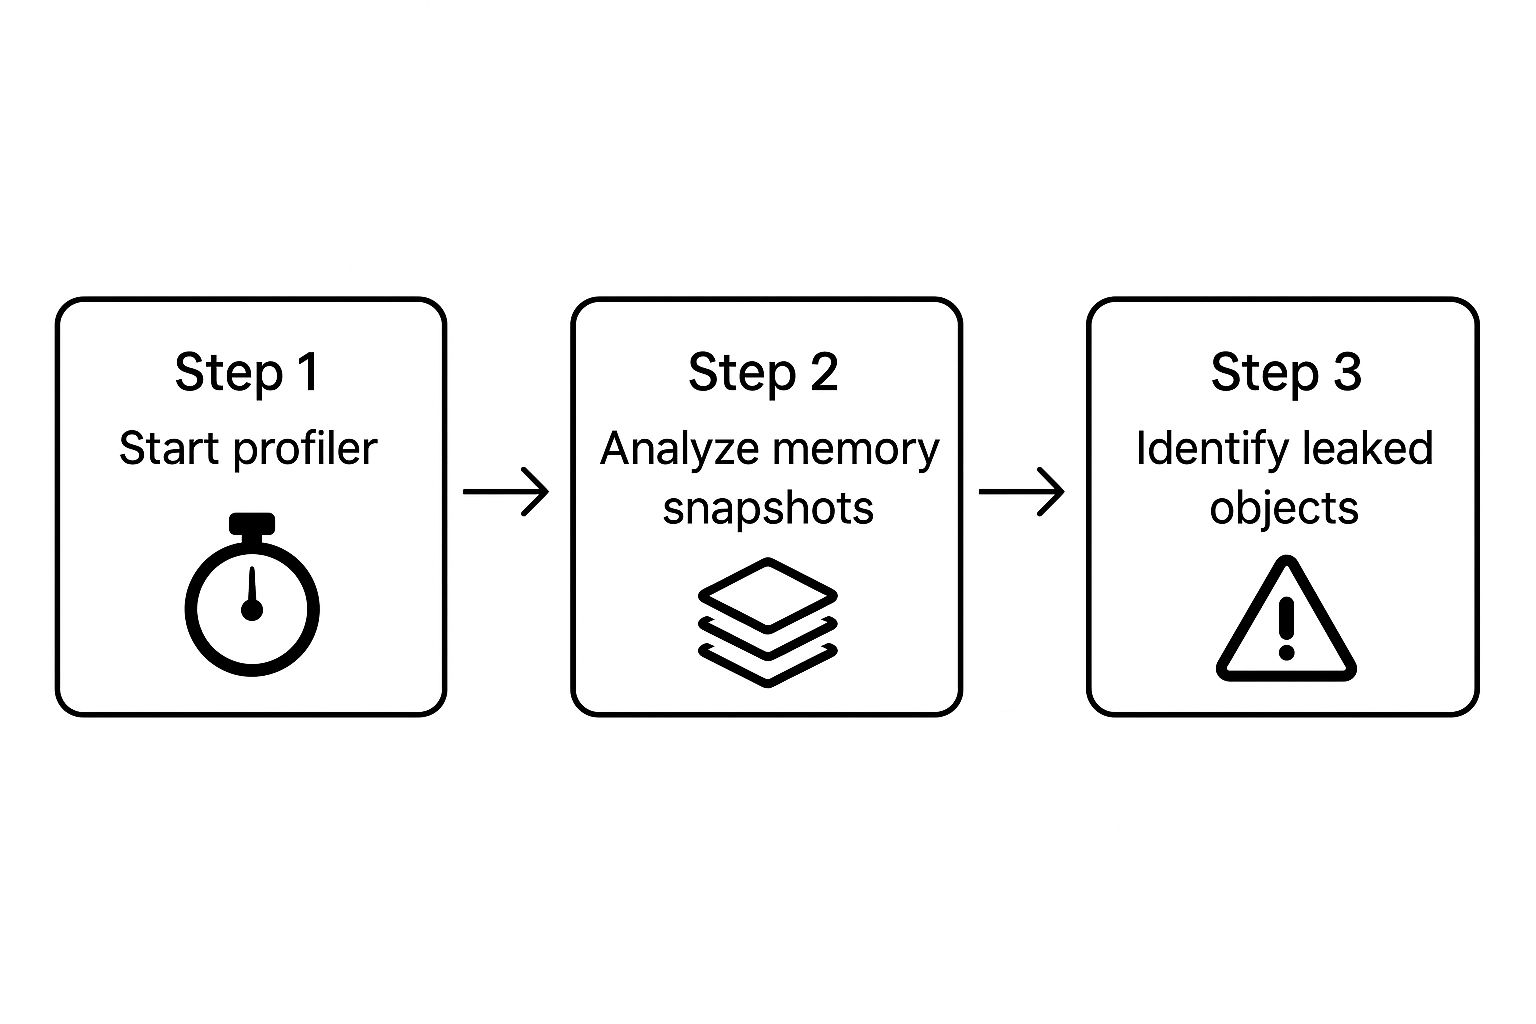
Alright, you've got your profiler picked out. Now for the fun part: the actual detective work. The whole game here is about comparison. You need a "before" and "after" snapshot of your application's memory to see what's hanging around when it shouldn't be.
First things first, you need a baseline. Before you start hammering the feature you think is leaking, take a memory snapshot. This gives you a clean picture of your app's memory usage when it's just sitting there, doing nothing. Think of it as the "control" in your experiment—without it, your results are meaningless.
Capturing Meaningful Memory Snapshots
With your baseline set, it's time to trigger the suspected memory leak while the profiler is watching. Go through the exact user actions or processes you believe are failing to clean up after themselves.
Let's say you're working on a web app. This could mean:
- Repeatedly opening and closing a specific modal.
- Navigating back and forth between two pages.
- Adding and then removing items from a shopping cart over and over.
The key here is repetition. A single action might not create a memory spike big enough to notice, but doing it 10, 20, or even 50 times will make a leak stick out like a sore thumb in the data.
After you've performed the action a bunch of times, take another memory snapshot. Some pros even take a third snapshot after forcing a garbage collection cycle. This little trick helps you zero in on objects that are truly stuck, not just those patiently waiting to be collected.
Interpreting the Profiler's Output
Now, let's make sense of the results. Your profiler will show you a comparison between your snapshots. You're not looking for every object that was created; you're hunting for the ones that were created and never got released.
Most profiling tools have a "delta" or "diff" view that compares two snapshots. This is your treasure map. Look for object types with a big, positive number next to them. If you see hundreds of ModalViewController objects still kicking around after you've closed that modal every single time, you've probably found your culprit.
The real skill in profiling is learning to filter out the noise. Your app creates and destroys thousands of objects every second. Your job is to spot the objects that are growing in number when they logically should have been garbage collected.
Your profiler will also show you something called the retaining path. This is the chain of references that explains why an object couldn't be garbage collected. It's a lifesaver. The path traces from the leaked object all the way back to a root object (like the window object in a browser), showing you exactly what's holding on to it. This is your most direct clue for finding the buggy code.
Pinpointing leaks is just one piece of the puzzle. A healthy app requires a broader focus on performance. For a deeper dive, check out these strategies to improve mobile app performance to get a more complete picture of maintaining application health.
Pinpointing the Root Cause in Your Code

So, your memory profiler has flagged a suspicious object. Great. Now the real detective work begins. The profiler gives you the what—the object that’s sticking around when it shouldn’t be—but it's your job to dig into the source code and find the why. This is where you translate the profiler's data into an actionable fix by hunting down the exact lines of code responsible.
In my experience, memory leaks rarely stem from some mind-bending algorithmic flaw. More often than not, they’re the result of simple oversights and common anti-patterns that are incredibly easy to miss in the heat of development. The good news? Once you learn to recognize them, you can stamp them out for good.
Dangling Event Listeners
One of the most frequent culprits I see, especially in JavaScript applications, is the dangling event listener. It’s a classic mistake: you add a listener to an element or object, but you forget to remove it when that element is destroyed. That listener holds a reference, keeping the object alive in memory long after it’s vanished from the UI.
For instance, picture a component that attaches a listener to the window object:
// A component adds a listener on mount
componentDidMount() {
  window.addEventListener('resize', this.handleResize);
}

// But it's never removed!
componentWillUnmount() {
  // Missing: window.removeEventListener('resize', this.handleResize);
}
This tiny omission means every time the component mounts and unmounts, a new handleResize function is left attached to window. The old component instance can never be garbage collected. The fix is as simple as it looks: just add the corresponding removeEventListener call in the cleanup phase.
Unclosed Resources
Another old-school leak pattern involves resources that need to be manually closed. This is super common in languages like Java or Go when you're dealing with file streams, database connections, or network sockets. The garbage collector can't clean up memory tied to these resources if their connections are left hanging open.
Take this Java snippet for reading a file:
try {
  FileReader reader = new FileReader("my-file.txt");
  // ... process the file
} catch (IOException e) {
  // ... handle error
}
// The 'reader' is never closed, leaving the file handle open.
The resource is never released, and you’ve got yourself a leak. Modern Java strongly encourages using a try-with-resources block, which guarantees the resource is closed automatically, whether the operation succeeds or throws an error.
A memory profiler points you to the symptom, but the root cause is almost always found in the code's logic. Focus on the lifecycle of your objects—when they're created, who references them, and when they're supposed to be destroyed.
Improper Use of Static Collections
Static collections, like a static Map or List in Java, are a notorious source of memory leaks. Why? Because they live for the entire duration of the application's runtime. If you keep adding objects to a static collection and forget to remove them, they will never be eligible for garbage collection.
These kinds of issues are what we often call "code smells"—surface-level indicators of deeper problems in your application's design. If you're curious to learn more, we've covered some of the most common code smells found in pull requests in another guide.
Spotting these patterns helps you fix the immediate bug and encourages you to write cleaner, more resilient code moving forward.
Here’s a quick rundown of some frequent leak patterns I've encountered and how to approach fixing them.
Common Memory Leak Patterns and Fixes
| Leak Pattern | Example (Code Concept) | The Fix |
|---|---|---|
| Dangling Event Listeners | A UI component adds a click listener to the document but never removes it on unmount. | Always pair addEventListener with removeEventListener in the component's cleanup or teardown logic. |
| Unclosed Resources | A function opens a file stream to read data but doesn't close it in a finally block or using try-with-resources. | Use language features that ensure resource closure automatically, like try-with-resources in Java or the using statement in C#. |
| Static Collections | A static HashMap is used as a cache, but entries are never explicitly removed. | Implement a clear removal strategy, like a cache eviction policy, or use a WeakHashMap if appropriate. |
| Circular References | Object A holds a reference to Object B, and Object B holds a reference back to Object A, preventing both from being collected. | Break the cycle by using weak references for one of the pointers or by manually nullifying the reference when it's no longer needed. |
| Timer/Interval Leaks | setInterval is called to run a task, but clearInterval is never called when the component is destroyed. | Store the timer ID and call clearInterval in the component's lifecycle cleanup method. |
Getting familiar with these patterns will make your debugging sessions a lot more productive. Instead of just staring at a profiler report, you'll know exactly what kind of code smells to hunt for.
Hunting Down Leaks in Complex Cloud Systems
When you graduate from a single application to a sprawling, distributed cloud system, hunting for memory leaks becomes a whole new ballgame. The classic approach of firing up a profiler and taking a few memory snapshots on your local machine just doesn't cut it anymore.
These complex environments are incredibly noisy. Memory usage is constantly in flux, bouncing around due to shifting workloads, auto-scaling events, and countless transient processes. It's organized chaos.
This is where traditional, threshold-based alerts completely fall apart. A slow-burning leak—one that quietly eats up memory over weeks or even months—can easily hide within the system's normal operational hum. By the time a simple alert finally triggers, you might already be staring down a critical, service-impacting outage.
Shifting to Long-Term Observability
To catch these subtle leaks, you have to change your mindset from short-term profiling to long-term observability. Forget one-off snapshots. You need to be collecting and analyzing memory usage data continuously across your entire fleet of servers.
This calls for more sophisticated tooling that can aggregate mountains of data, spot subtle trends, and automatically flag anomalies that a human would almost certainly miss.
Modern observability platforms are built for this. They let you:
- Track Memory Trends: See how memory consumption is changing for individual services, containers, and nodes over long stretches of time.
- Establish Dynamic Baselines: Use machine learning to figure out what "normal" memory usage looks like for a service, even accounting for daily or weekly cycles.
- Set Up Anomaly Detection: Configure smart alerts that fire when memory usage deviates from its established baseline, even if it hasn't crossed some arbitrary hard-coded threshold.
This kind of proactive monitoring helps you spot the gradual, upward creep of a slow leak long before it can take down your system. Many of these capabilities are baked into modern Application Performance Monitoring (APM) solutions. You can find a solid list of developer productivity tools that integrate this level of monitoring into your workflow.
The most dangerous leaks in cloud systems are the ones you can't see with a traditional profiler. They are slow, subtle, and spread across many instances, requiring a data-driven, automated detection strategy to uncover.
AI-Driven Detection Strategies
The industry is increasingly leaning on AI-powered operations (AIOps) to wrestle with these tough problems. Microsoft's Azure cloud team ran into this exact issue, finding that their traditional methods were struggling to catch slow leaks at scale.
They ended up building a system called RESIN, which uses a two-level strategy to hunt down these sneaky bugs amidst the immense operational noise of Azure. It first analyzes memory data in buckets across groups of hosts to identify suspicious components. From there, it drills down to perform detailed leak detection on individual processes.
This advanced, automated approach allows them to find leaks that have been hiding in plain sight for months. You can read more about how RESIN advances memory leak detection on the Microsoft Azure blog. It’s a perfect example of a critical trend: for today's complex systems, manual checks are no longer enough.
Got Questions About Memory Leaks?
Even with the best tools, a few common questions always pop up when you're hunting down memory leaks. Let's tackle some of the usual points of confusion to give you some quick, clear answers.
A big one I hear a lot is whether a garbage collector makes your app immune to memory leaks. While garbage collectors (GC) are incredible at automatically reclaiming memory, they aren't a silver bullet. A GC can only free up memory that’s no longer referenced anywhere in your application.
If your code is accidentally holding onto a reference—maybe through a forgotten event listener or an object that never gets removed from a static collection—the GC will see it as "in use." And it won't touch it.
That's the real reason leaks still happen in managed languages like Java, C#, and JavaScript. The leak isn't a failure of the garbage collector itself; it's a logic bug in your code that's preventing the GC from doing its job.
What Is The Difference Between Precision and Recall in Leak Detection?
When you start looking at automated leak detection tools, you'll run into statistical terms like precision and recall. They're important because they tell you how much you can trust the tool's results.
Think of it this way:
- Precision asks: "Of all the leaks this tool flagged, how many were actually leaks?" High precision means you're not wasting your day chasing down false alarms.
- Recall asks: "Of all the real leaks hiding in my code, how many did this tool actually find?" High recall means the tool is doing a thorough job and isn't missing much.
You've got to find a balance. A tool with high recall but low precision will flag everything under the sun, creating a ton of noise. On the flip side, a tool with high precision but low recall might only catch the most obvious leaks, leaving the sneaky ones behind.
This trade-off is often measured by something called the F-measure, which is just a fancy way of combining precision and recall into a single score. It gives you a snapshot of a tool's overall effectiveness, which is super helpful when you're comparing different detection algorithms. If you want to get into the weeds, you can learn more about the statistical side of assessing memory leak detection algorithms.
Can A Memory Leak Fix Itself?
Nope, a true memory leak will never resolve on its own. It's a bug, plain and simple—memory gets allocated but never given back. Over time, your application's memory usage just keeps climbing until it either crashes from an out-of-memory error or has to be restarted.
Restarting the application is a temporary fix, of course. It wipes the slate clean by clearing all allocated memory. But the bug is still lurking in the code, and the leak will start all over again as soon as the application is back up and running.
The only real, permanent solution is to roll up your sleeves, find the root cause in the code, and fix it for good.
Stop letting pull request notifications overwhelm your team. PullNotifier integrates seamlessly with Slack to deliver quiet, organized, and actionable PR updates, cutting review delays by up to 90%. See how it works at PullNotifier.com.