- Published on
Key Performance Indicators Engineering: A Practical Guide to Measuring Impact
- Authors

- Name
- Gabriel
- @gabriel__xyz
In the world of software engineering, Key Performance Indicators (KPIs) are the measurable values that tell you if your team is actually winning. They’re not about tracking activity for the sake of it; they're about measuring the outcomes that tie day-to-day coding to the bigger business picture.
Think of them as the vital signs for your entire engineering organization.
From Code Commits to Business Impact
Imagine you're navigating a massive ship across the ocean. Your destination is a successful product launch. Would you measure your progress by counting how many times the crew hoists the sails? Of course not. You'd be looking at your compass, your speed, and the health of your engines.
Key Performance Indicators (KPIs) are your ship's dashboard. They give you clear, objective data on what’s actually moving you forward.
Why Do Engineering KPIs Matter?
Good KPIs help teams ditch "vanity metrics"—like lines of code written—which often just reward busywork. Instead, they shine a light on the signals that actually drive improvement. When you get your KPI strategy right, you can:
*   **Identify Bottlenecks:** Instantly see where work is getting stuck, whether it's in code review, testing, or deployment.
*   **Improve Predictability:** Get a real sense of how consistently your team delivers, which makes planning far more reliable.
*   **Enhance Software Quality:** Track metrics that have a direct link to system stability and happy users.
*   **Boost Team Health:** Measure the subtle signs of burnout or process friction, so you can maintain a sustainable pace.
The whole point of key performance indicators engineering is to use data as a compass for improvement, not as a tool for judgment. It’s all about making your systems better so your people can do their best work.
Connecting Work to Value
The real magic happens when you can draw a straight line from an engineer's pull request all the way to a top-level business goal. For example, a sluggish code review process is a classic friction point that kills momentum. This is exactly why tools like PullNotifier exist—to fix that specific workflow by connecting GitHub and Slack more intelligently.
By tracking a metric like Code Review Velocity, a team can measure the direct impact of a tool like that on their entire development cycle.
This isn't about tracking every number you possibly can. It's about strategically choosing, implementing, and acting on the few metrics that give you the most insight. To go deeper on this, check out our guide on how to approach engineering productivity measurement. By focusing on the right indicators, you turn a sea of abstract data into real, actionable intelligence that guides your team to ship better software, faster.
The Four Pillars of Engineering Performance
To get a complete picture of your engineering team's performance, you need to look at more than just one thing. If you only focus on shipping code fast, you risk burnout and sloppy work. But if you obsess over quality and nothing else, you'll slow innovation to a crawl. The best approach is to find a healthy balance.
Think of it like building a sturdy table. If one leg is too short or weak, the whole thing wobbles and eventually falls apart. A high-performing engineering organization needs four strong pillars to keep it stable and sustainable.
This framework is built on four key areas, each answering a critical question about your team's effectiveness. By tracking metrics across all four, you can drive real, holistic improvement without letting one area suffer for the sake of another.
This diagram shows how these performance pillars connect the day-to-day work of engineers to the bigger business goals.
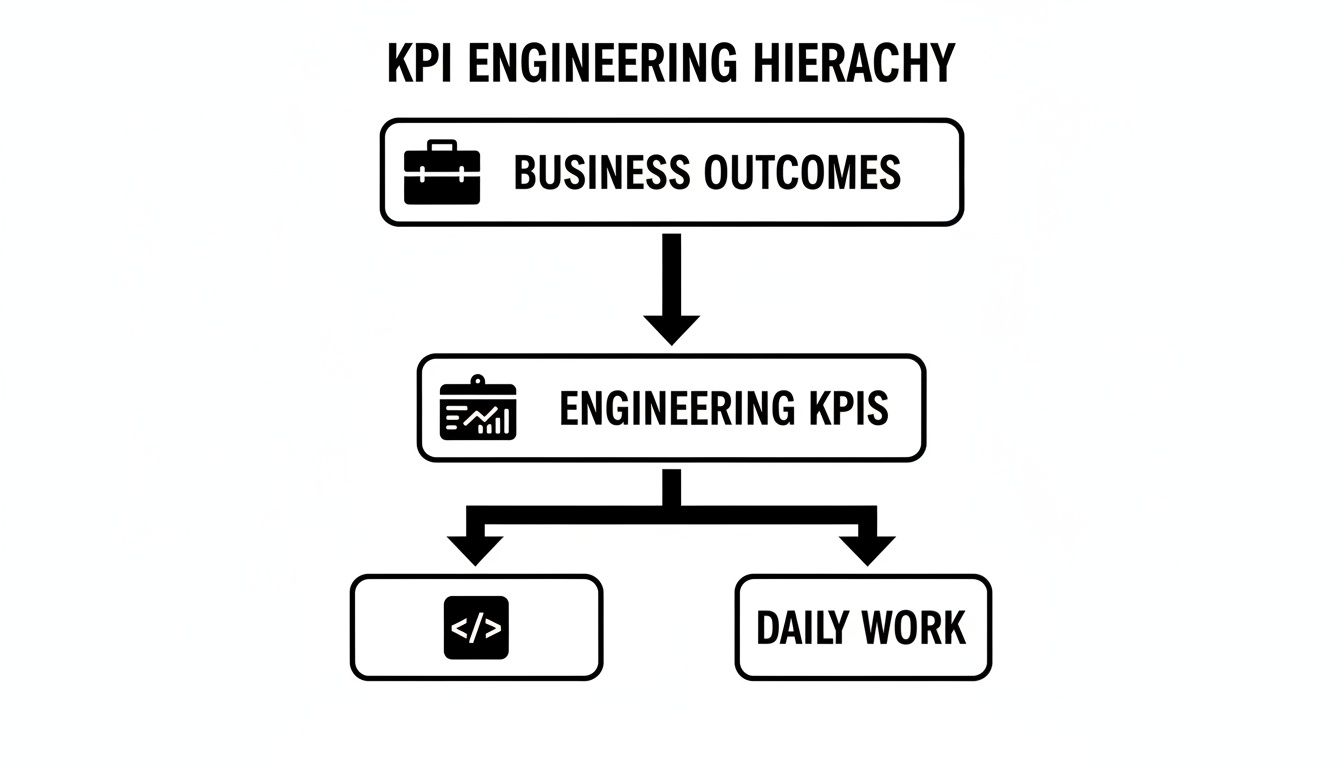
As you can see, engineering KPIs are the bridge that turns low-level development activities into measurable business outcomes.
Delivery and Velocity
This first pillar answers a simple question: How quickly and predictably are we shipping value to our users? It’s all about the rhythm and pace of your development cycle.
Metrics in this bucket measure the full journey of an idea, from the first line of code all the way to production. Strong performance here means you have an agile team that can react quickly to customer feedback and market changes. Key metrics usually include:
*   **Deployment Frequency:** How often does your team successfully push code to production?
*   **Lead Time for Changes:** How long does it take from a code commit to a live release?
Improving these metrics usually involves streamlining everything from code reviews to your automated testing pipeline.
Quality and Reliability
The second pillar zeroes in on stability, asking: How reliable is our software, and how resilient are our systems? Pushing code fast is great, but speed without quality is a recipe for disaster. It leads to frustrated customers and late-night outages.
This group of KPIs gives you a clear view of your codebase's health and your infrastructure's dependability. Tracking these metrics ensures that as you ship faster, you aren't accidentally introducing more bugs or instability. Common metrics here include:
*   **Change Failure Rate:** What percentage of your deployments cause a failure in production?
*   **Mean Time to Recovery (MTTR):** On average, how long does it take to fix things after an incident?
A sharp focus here builds trust with your users and frees up your engineers from constant, reactive bug-fixing.
Efficiency and Flow
Our third pillar looks inward at your team's processes, asking: How smooth are our internal development workflows? This is where you hunt down the friction and bottlenecks that slow your team down and cause headaches.
An efficient process helps developers get into a state of "flow," where they can focus on solving tough problems instead of getting stuck on avoidable hurdles. For a deeper dive, check out our article on the trade-offs between code quality and delivery speed.
When you find and remove obstacles—like sluggish code reviews or manual testing processes—you give every other pillar a boost. Efficient systems naturally lead to faster delivery, higher quality, and happier, more productive developers.
Team Health
Finally, the fourth pillar focuses on the people: Is our team working at a sustainable pace, and are our developers engaged? This is arguably the most important pillar of all. A burnt-out or disengaged team simply can't perform well in the long run.
These KPIs are often more qualitative, measuring things like developer satisfaction, workload balance, and collaboration. Ignoring team health is a classic mistake that leads to high turnover, plummeting productivity, and a dead end for innovation. You might track metrics like focus time, meeting overload, or even how code reviews are distributed to prevent burnout among your most critical team members.
Tracking Your Delivery and Velocity KPIs
When you're building software, speed is a huge part of the equation. Delivery and velocity KPIs are basically the speedometers for your engineering team. They answer one critical question: "How fast are we shipping valuable code to our users?" These metrics cut through the guesswork and give you a clear, objective look at your team's agility.
Think of your development process like a factory assembly line. The goal isn't just to keep the line moving, but to make sure high-quality products are rolling off at a steady, predictable pace. Delivery KPIs measure the speed and rhythm of this entire production line, from the first line of code to the final release.
Strong performance here is a dead giveaway of a healthy CI/CD pipeline and an agile workflow. It means your team can react quickly to market shifts, act on customer feedback, and push out value without getting stuck in internal bottlenecks. Let's dig into the two most important key performance indicators engineering teams use to measure this.
Deployment Frequency
Deployment Frequency measures exactly what it sounds like: how often your team successfully pushes code to production. It's a direct signal of your team's agility and the health of your automation pipeline.
A high deployment frequency usually points to a few good habits:
*   **Small, Manageable Changes:** Your team is likely shipping smaller batches of code, which are far easier to test, review, and deploy.
*   **Robust Automation:** You have a solid CI/CD process that can handle frequent releases without someone having to manually push buttons.
*   **Faster Feedback Loops:** More deployments mean you get feedback from real users faster, which lets you iterate and improve much more quickly.
The best teams deploy on-demand, sometimes multiple times a day. At the other end of the spectrum, low-performing teams might only deploy once every few months. This isn't just about going fast for the sake of it; it's about building a delivery "muscle" that actually reduces risk with every single release.
Lead Time for Changes
While Deployment Frequency tracks how often you ship, Lead Time for Changes measures how long it takes to get there. This is the clock-on-the-wall time from the moment a developer commits code to that code being live in production. This metric gives you the unvarnished truth about the efficiency of your entire development lifecycle.
A long lead time is almost always a sign of serious bottlenecks in your process.
Lead Time for Changes is the ultimate stress test for your end-to-end delivery pipeline. It shines a spotlight on every single delay—from slow code reviews and manual testing to clunky approval gates—giving you a precise map of where you need to improve.
The gap between elite and low-performing teams here is genuinely staggering. According to the well-known DORA report, elite teams get their lead time down to under one hour, while low performers can take over six months. That's a massive 2,900x difference. More recent benchmarks show top-quartile firms averaging around 82 minutes, mostly thanks to smart automation. In major tech hubs, these kinds of delays are estimated to cost $300 billion a year in lost value. You can find more insights on these crucial engineering metrics over at BrowserStack.
Key Delivery KPIs at a Glance
To make this simple, here’s a quick-reference table that breaks down these two core delivery metrics. It covers what they measure, how to calculate them, and what a good target looks like.
| KPI | What It Measures | How to Calculate | Ideal Target (Elite Teams) |
|---|---|---|---|
| Deployment Frequency | How often code is successfully released to production. | Total number of deployments in a given period (e.g., per day, per week). | On-demand (multiple deployments per day). |
| Lead Time for Changes | The time it takes from code commit to production release. | Median time from first commit to successful deployment for a given change. | Less than one hour. |
Keeping an eye on these two numbers will tell you a lot about your team’s ability to ship value consistently and quickly.
Identifying and Fixing Bottlenecks
So, what’s usually dragging these metrics down? The most common culprit, by far, is a slow or chaotic code review process. When pull requests (PRs) just sit there for days waiting for feedback, your Lead Time for Changes balloons, and your Deployment Frequency grinds to a halt.
This is almost always a communication problem, not a technical one. Developers are drowning in a sea of notifications, and important review requests simply get lost in the noise. This is exactly where a tool like PullNotifier can make a huge difference.
By smartly integrating GitHub and Slack, PullNotifier cuts through the clutter. It consolidates all PR updates into a single, clean thread and uses intelligent routing to ping the right reviewers at the right time. Teams that use PullNotifier often see a dramatic drop in how long PRs hang around, which directly improves both of these core delivery KPIs.
For more actionable advice, check out our guide on proven strategies to reduce cycle time.
By focusing on these two fundamental delivery metrics, you can start turning your engineering process from a slow, unpredictable slog into a smooth, efficient engine for creating real customer value.
Measuring Software Quality and Reliability
Shipping code fast is a huge win, but if that speed comes at the cost of stability, you’re just creating tomorrow’s problems today. The best engineering teams get this. They know that velocity without quality is a hollow victory. This brings us to the second pillar of performance: the KPIs that safeguard excellence and build user trust.
These metrics aren't about pointing fingers when something breaks. They’re about building systems so tough that failures become minor, quickly resolved blips. Think of it this way: a race car is built for speed, but its most critical parts are the brakes, roll cage, and fire suppression system. Quality and reliability KPIs are your engineering team’s safety features, making sure you can move fast without crashing and burning.
Change Failure Rate
The Change Failure Rate (CFR) is a vital sign for measuring stability. It answers a simple but powerful question: "Of all our deployments, how many cause a failure in production?" A failure could be anything from a full-blown outage to a nasty bug that ruins the user experience.
The goal isn't a 0% failure rate. If you have zero failures, it probably means you’re not taking enough risks or you're shipping way too slowly. Instead, CFR is a lens for seeing how healthy your deployment process really is. A rising CFR could be a red flag for issues with your automated tests, a gap in your code review process, or a sign that your changes are just too big and complex.
Change Failure Rate shouldn't be a blame game. It’s a diagnostic tool for your entire system. A high rate signals your process needs help, not that your engineers are messing up.
Tracking this metric helps you build a culture of psychological safety, not fear. When a deployment fails, the conversation shifts from "Who did this?" to "What can we change in our process to keep this from happening again?" That's how teams get comfortable experimenting and innovating. To get the full picture, it's worth understanding the fundamentals of what quality assurance in software development truly entails.
Mean Time to Recovery
While CFR tells you how often things break, Mean Time to Recovery (MTTR) tells you how fast you can fix them. This KPI tracks the average time it takes to get things back to normal after an incident is detected. In many ways, MTTR is the ultimate measure of your team’s resilience.
Look, failures are going to happen in any complex system. What separates elite teams from everyone else is their ability to bounce back with minimal disruption. A low MTTR is a clear sign a team has nailed a few key things:
*   **Top-Notch Monitoring and Alerting:** You can't fix what you don't know is broken. Spotting the problem fast is step one.
*   **Solid Incident Response:** When an alert fires, the team has a clear, well-rehearsed plan for diagnosing and fixing the issue.
*   **Strong CI/CD Practices:** The ability to quickly roll back a bad deployment or push a fix forward is absolutely critical.
Focusing on lowering MTTR naturally pushes you to build systems that are not just robust, but also easy to repair. It encourages prioritizing clean logs, creating useful dashboards, and automating recovery steps wherever you can.
The Connection Between Speed and Stability
It might sound strange, but the same practices that boost your delivery KPIs—like Deployment Frequency and Lead Time for Changes—also have a massive positive effect on quality and reliability. Shipping smaller, more frequent updates is just inherently less risky than dropping a monster deployment once a month.
Here’s why that works:
- Easier Diagnosis: When a tiny change causes a failure, it’s a whole lot easier to pinpoint the exact cause.
- Faster Fixes: Small changes mean you can roll back or deploy a hotfix in minutes, which directly slashes your MTTR.
- Reduced Risk: Each individual deployment has a much smaller blast radius, so the odds of a major, catastrophic incident go way down.
When you focus on both delivery and quality metrics, you create a virtuous cycle. Faster, smaller deployments lead to more stable systems. And more stable systems give you the confidence to deploy even faster. This balanced approach is the real hallmark of a high-performing engineering organization.
Putting Your Engineering KPIs into Action
Knowing what to measure is one thing, but turning that knowledge into a practical, day-to-day workflow is where the magic really happens. This is your guide to actually implementing a system for tracking key performance indicators in engineering. We’ll walk through the whole process, from figuring out where your data is to building a culture that uses it for real improvement.
This isn’t about creating some ridiculously complex dashboard that nobody ever looks at. It’s about building a simple, powerful feedback loop that connects your team's everyday work to the company's goals, creating a flywheel of progress.
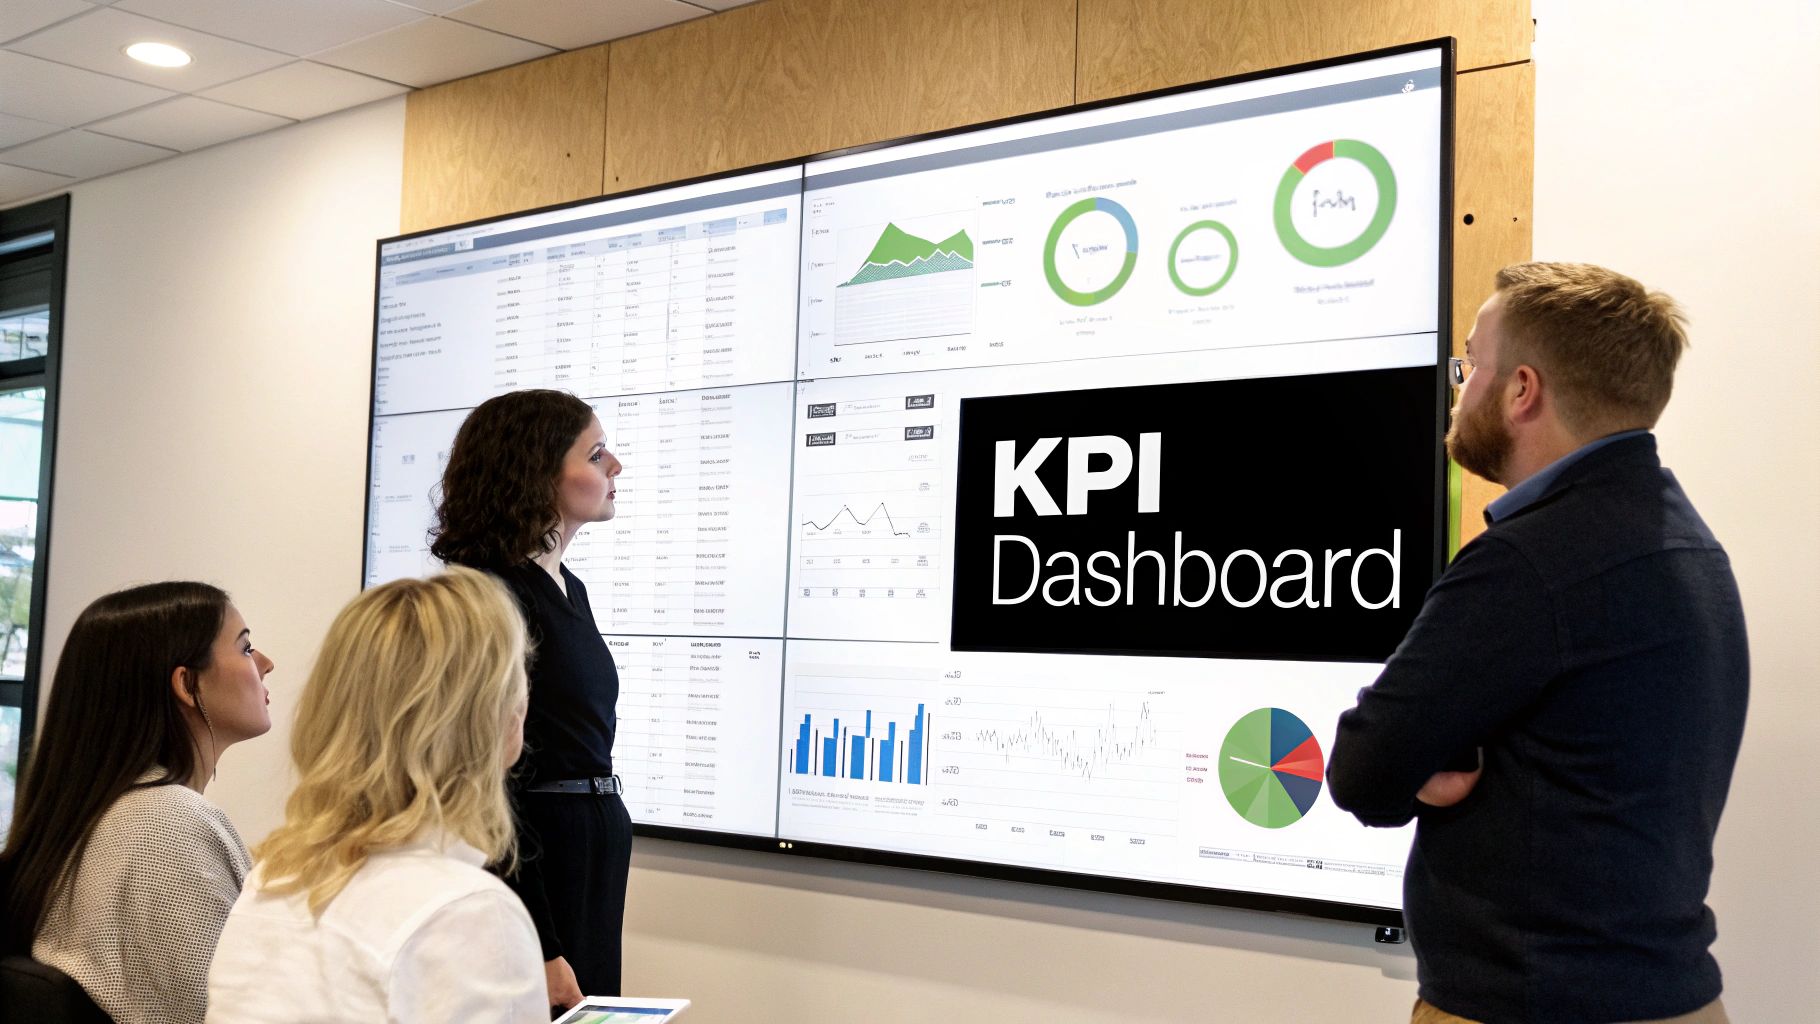
A visual dashboard like this becomes a single source of truth, helping everyone align on what’s important and track progress together.
Identify Your Data Sources
Before you can measure anything, you've got to know where the data actually lives. The good news is your engineering team is already a data-generating machine—every commit, PR, and deployment is a data point. The trick is tapping into these systems instead of making everyone track things in a spreadsheet.
Your main sources of truth will almost always be:
*   **Version Control (like GitHub or GitLab):** This is your goldmine for anything code-related. It's got the goods on commits, pull request sizes, merge frequency, and how long code reviews are taking.
*   **Project Management Tools (like Jira or Linear):** This system tracks the entire life of a task or story. It’s where you'll find the data you need for metrics like Cycle Time and get a clear picture of how work moves through your process.
*   **CI/CD Pipeline (like Jenkins or GitHub Actions):** Your deployment tools are the final word on **Deployment Frequency** and **Change Failure Rate**. Every single release, success, and rollback is logged right here.
By hooking into these tools, you can automate your data collection and make sure your KPIs are always based on objective, real-time information.
Build Your Dashboard and Set Baselines
Once you know where the data is, you need to make it visible and easy to understand. That’s what a dashboard is for. Whether you use a dedicated engineering intelligence platform or build your own with something like Grafana, the goal is the same: create one clear, shared view of the metrics that matter most.
A dashboard isn’t just a report for managers; it's a tool for the whole team. When everyone can see the numbers, it sparks curiosity and empowers engineers to spot and solve their own problems.
With your dashboard up and running, the very first thing to do is establish a baseline. Don't just pull targets out of thin air. Let the data flow for a few sprints or a month to get a real sense of where your team is right now. This baseline gives you a realistic starting point to build from.
When it's time to act on these KPIs, being able to visualize the data properly is crucial. Using a dedicated statistical tool, like a Box And Whisker Plot Maker, can help you instantly grasp the distribution and variability of metrics like deployment frequency or code review times.
Establish a Healthy Review Cadence
Here’s the most critical part: how you actually use the data. Numbers on a screen are just noise until you talk about them. The goal is to set up a regular, blameless rhythm where the team can look at the trends and decide what to do next, together.
Here's a simple framework for a healthy review process:
- Schedule Regular Check-ins: Carve out a little time in your retrospectives or a separate monthly meeting to go over the KPI dashboard.
- Focus on Trends, Not Absolutes: Don't get hung up on a single bad day. Look for the patterns over weeks and months. Is cycle time slowly creeping up? Has deployment frequency hit a plateau?
- Ask "Why," Not "Who": If a metric is heading in the wrong direction, the question is always, "What's in our process that’s causing this?" It's never, "Whose fault is this?"
- Agree on One Small Experiment: Based on what you see, pick one small process change to try before the next check-in. This keeps the focus on taking small, actionable steps forward.
For example, Deployment Frequency is a massive KPI in software engineering, showing how often you're getting code into production. The DORA State of DevOps Report shows elite teams deploying multiple times a day, while low performers might only ship once every six months. For managers, tracking this can expose bottlenecks in the CI/CD pipeline; some teams using GitHub Actions have seen a 208% jump in deployment speed just by automating tests.
By creating this kind of structured, collaborative review, you can transform your key performance indicators engineering strategy from a boring reporting task into a powerful engine for continuous, team-driven growth.
Common Questions About Engineering KPIs
Shifting to a more data-informed engineering culture isn't without its hurdles. Even when you've nailed down the core metrics, the real world throws curveballs. Let's tackle some of the most common questions that pop up when teams start putting these ideas into practice.
Think of this as your field guide for navigating those tricky conversations and turning your key performance indicators engineering strategy into a genuine success.
What Are the Biggest Mistakes to Avoid with KPIs
The path to using data effectively is littered with good intentions that went sideways. The single biggest mistake is weaponizing metrics. Using KPIs for individual performance reviews is a surefire way to kill morale and trust. It instantly creates a culture of fear, where people will game the numbers instead of genuinely improving the process.
Another classic blunder is chasing vanity metrics. It feels good to track "lines of code" or "number of commits," but these numbers tell you absolutely nothing about the value you're shipping to customers. Stick with outcome-focused metrics, like the DORA set, that tie engineering work back to what the business actually cares about.
To sidestep these traps, keep these pointers in mind:
*   **Avoid Over-Measurement:** Don't bury your team in charts and graphs. Kick things off with just **3-4** core metrics that map directly to your most critical business goals. Too much data is just noise.
*   **Never Ignore Context:** Comparing raw numbers between teams is almost always a mistake. A platform team will have vastly different goals and metrics than a product team. Always evaluate performance within its own unique context.
*   **Data Must Drive Action:** The whole point of tracking KPIs is to start conversations and make things better. If you’re just collecting data and letting it sit there, you're wasting everyone's time.
How Do You Get Buy In from Skeptical Developers
Getting your engineering team on board is non-negotiable. If they don't trust the process, it's doomed from the start. The trick is to frame these metrics as tools for improving the system, not for judging the people within it. Position KPIs as a way to shine a light on the very things that drive developers nuts—like painfully slow builds, flaky tests, or code reviews that take forever.
Start by bringing the team into the conversation. Ask them directly, "What's slowing us down? What's the biggest bottleneck you face every day, and how can we measure our progress in fixing it?" When engineers help choose the metrics, they feel a sense of ownership.
Then, be radically transparent. Make dashboards visible to everyone and discuss the trends together in retrospectives—never in one-on-one performance reviews.
When developers see that KPIs are being used to make their daily work life better, they'll flip from skeptics to your biggest champions. You have to show them this is a shared tool for making everyone's job easier.
Should Startups and Enterprises Focus on the Same KPIs
While the core DORA metrics—Deployment Frequency, Lead Time for Changes, MTTR, and Change Failure Rate—are solid gold for just about everyone, their importance can shift dramatically based on a company's size and stage. The fundamentals of key performance indicators engineering are universal, but the focus changes with the business's needs.
Startups, for example, live and die by their speed. They're in a race to find product-market fit, so Delivery and Velocity KPIs are king. Metrics like Lead Time for Changes and Deployment Frequency are everything because they measure the ability to learn and pivot on a dime.
On the other hand, large enterprises are playing a different game. They have to manage massive complexity and risk. For them, Quality and Reliability KPIs like Change Failure Rate and Mean Time to Recovery are just as vital as speed, if not more so. A single major outage can have devastating financial and reputational consequences, making stability a top priority. Enterprises also get huge wins from Efficiency Metrics, because even tiny improvements create massive gains when scaled across hundreds of teams.
Ready to eliminate the biggest bottleneck in your delivery pipeline? PullNotifier integrates GitHub with Slack to cut through the noise of code reviews, reducing delays by up to 90%. Start streamlining your pull requests today at PullNotifier.