- Published on
KPI Software Engineer Guide: kpi software engineer Metrics to Boost Performance
- Authors

- Name
- Gabriel
- @gabriel__xyz
In modern software development, measuring what truly matters is the key differentiator between good teams and elite-performing organizations. While traditional metrics like lines of code or story points offer some insight, they often fail to capture the full picture of efficiency, quality, and team health. The most effective engineering leaders look deeper, focusing on a balanced set of Key Performance Indicators (KPIs) that reveal workflow bottlenecks, improve code quality, and ultimately accelerate value delivery.
A well-chosen kpi for a software engineer doesn't just measure output; it illuminates the entire development lifecycle, from idea to deployment. It helps answer critical questions: How quickly can we ship new features? How stable are our releases? Are we improving our review processes, or creating bottlenecks? Understanding these metrics is crucial across various roles, from leadership planning resource allocation to an individual developer refining their workflow. To truly understand engineering excellence, it's helpful to consider the specific responsibilities and performance expectations within a Frontend Developer career path, where metrics like cycle time directly impact user experience.
This guide provides an actionable roundup of the 10 most valuable KPI software engineer metrics used by top-tier companies. For each KPI, we'll break down:
*   **What it is:** A clear, concise definition.
*   **How to measure it:** Practical formulas and methods.
*   **Why it matters:** The direct impact on team performance and business outcomes.
*   **How to improve it:** Actionable strategies and tools to turn data into progress.
We'll move beyond tracking and into improving, offering practical strategies and examples of how tools like PullNotifier can streamline your workflows and turn these metrics into a tangible competitive advantage. Let's dive into the KPIs that truly define engineering excellence.
1. Code Review Velocity
Code Review Velocity, often called Time to First Review, measures the average time between when a pull request (PR) is submitted and when it receives its first meaningful review comment or approval. This critical KPI for a software engineer directly tracks how quickly the team responds to new code, which is a major bottleneck in the development lifecycle. Slow review times leave developers blocked, increase context-switching, and extend the overall cycle time.
This metric was popularized by engineering powerhouses like Google and is a core concept within frameworks like DORA. It focuses on the initial response, as this first touchpoint unblocks the author and kicks off the feedback loop.
Why It's a Key KPI
A low Code Review Velocity indicates a healthy, collaborative engineering culture where team members prioritize unblocking each other. It ensures that code doesn't stagnate while waiting for feedback, allowing for faster iteration and deployment. For engineering managers, tracking this KPI helps identify process bottlenecks, team overload, or a need for clearer ownership.
How to Measure and Improve It
You can calculate this metric by taking the timestamp of the first review comment and subtracting the timestamp of the PR creation. Averaging this across all PRs in a given period gives you your team's velocity.
Actionable Tips for Improvement:
*   **Set Clear SLAs:** Establish team-wide Service Level Agreements (SLAs) for reviews. For example, aim for a response within 4 business hours for standard PRs and under 1 hour for critical fixes.
*   **Automate Notifications:** Delays often happen because reviewers simply miss notifications. Tools like [PullNotifier](https://pullnotifier.com/?utm_source=blog&utm_medium=referral&utm_campaign=kpi-software-engineer-guide-kpi-software-engineer-metrics-to-boost-performance) solve this by sending real-time, customizable alerts directly to Slack, ensuring PRs are seen immediately by the right people.
*   **Implement Smart Routing:** Use customizable routing rules to automatically assign reviewers based on code ownership, team, or file path. This eliminates the manual step of finding the right reviewer.
*   **Track Trends:** Monitor this KPI weekly. A sudden spike might indicate that the team is under-resourced or that a specific project is causing review delays.
Key Insight: Balancing speed with quality is crucial. Pair this KPI with metrics like Change Failure Rate to ensure that faster reviews don't lead to a decline in code quality. The goal is a swift response, not a rubber-stamp approval.
2. Pull Request Cycle Time (Lead Time for Changes)
Pull Request Cycle Time, also known as Lead Time for Changes, measures the total duration from when the first commit is made on a branch to when that code is merged into the main branch. This end-to-end KPI for a software engineer provides a holistic view of the development pipeline's efficiency, encompassing coding, review, feedback implementation, and CI/CD validation. It answers the fundamental question: "How long does it take for an idea to become production-ready code?"

This metric is a cornerstone of the DORA (DevOps Research and Assessment) framework, championed by the authors of Accelerate. It directly correlates with an engineering team's ability to deliver value to users quickly and predictably.
Why It's a Key KPI
A short PR Cycle Time signals an efficient, streamlined development process with minimal friction. Teams with low cycle times can ship features faster, respond to market changes more effectively, and reduce the risk associated with large, long-running branches. Tracking this KPI helps managers pinpoint systemic delays, whether they stem from slow reviews, flaky test suites, or complex deployment procedures. For a software engineer, a low cycle time means less time spent on blocked work and more time creating value.
How to Measure and Improve It
Calculate this metric by taking the timestamp of the PR merge and subtracting the timestamp of the first commit on that branch. DORA benchmarks elite performers at under one hour, while low performers can take over six months.
Actionable Tips for Improvement:
*   **Break Down the Cycle:** Segment the cycle time into its core components: coding time, review lag time, feedback implementation time, and merge/deploy time. This helps identify the biggest bottleneck.
*   **Keep PRs Small:** Encourage small, single-purpose pull requests. They are faster to review, easier to test, and less risky to merge, significantly reducing overall cycle time.
*   **Automate Pre-Review Checks:** Use linters, static analysis, and automated tests to catch common issues before a human reviewer ever sees the code. This reduces back-and-forth and focuses reviews on logic and architecture.
*   **Leverage Smart Tooling:** Use a tool like [PullNotifier](https://pullnotifier.com/?utm_source=blog&utm_medium=referral&utm_campaign=kpi-software-engineer-guide-kpi-software-engineer-metrics-to-boost-performance) to gain visibility into cycle time trends with its sprint progress tracking. For more tips, you can explore these [7 proven strategies to reduce cycle time](https://blog.pullnotifier.com/blog/7-proven-strategies-to-reduce-cycle-time-in-2025).
Key Insight: Cycle Time is a team metric, not an individual performance tool. Use it to diagnose process inefficiencies, not to compare individual developers. A high cycle time is often a symptom of system-level problems, such as a convoluted review process or insufficient CI/CD resources.
3. Deployment Frequency
Deployment Frequency measures how often an organization successfully releases code to production. This is a core DORA metric that serves as a powerful indicator of a team's delivery performance, CI/CD pipeline maturity, and overall agility. A high deployment frequency signals that an organization can deliver value to users quickly, respond to market changes, and reduce the risk associated with large, infrequent releases.
This metric was heavily popularized by the DORA (DevOps Research and Assessment) team and is a central theme in books like Accelerate and The Phoenix Project. Elite teams, like those at Amazon or Netflix, deploy multiple times per day, demonstrating a highly evolved and automated delivery process that is a key competitive advantage.
Why It's a Key KPI
A high Deployment Frequency is the hallmark of a high-performing engineering organization. It reflects a mature, automated, and low-friction path to production, which allows teams to ship smaller, more manageable changes. This reduces deployment risk, shortens feedback loops, and increases a software engineer's sense of impact and ownership. For managers, tracking this KPI for a software engineer and their team provides a clear view of throughput and delivery capabilities.
How to Measure and Improve It
You can calculate this metric by simply counting the number of successful deployments to the production environment over a specific period (day, week, or month). Most CI/CD platforms like Jenkins, GitLab CI, or GitHub Actions can provide this data directly.
Actionable Tips for Improvement:
*   **Automate Your Pipeline:** Invest in a robust CI/CD pipeline. The entire process from commit to deployment should be automated, requiring minimal human intervention.
*   **Implement Feature Flags:** Decouple deployment from release using feature flags. This allows you to deploy code to production without making it visible to users, reducing the pressure and risk of each deployment.
*   **Improve PR Throughput:** Faster deployments start with faster code reviews and merges. Use tools like [PullNotifier](https://pullnotifier.com/?utm_source=blog&utm_medium=referral&utm_campaign=kpi-software-engineer-guide-kpi-software-engineer-metrics-to-boost-performance) to send real-time alerts for new PRs, ensuring the pipeline isn't blocked by slow reviews.
*   **Start Small:** If your team deploys monthly, aim for weekly. If weekly, aim for daily. Incremental improvements are more sustainable than a sudden, dramatic shift.
Key Insight: High frequency is meaningless without stability. Always pair Deployment Frequency with Change Failure Rate. The goal is to deliver value quickly and reliably, not just quickly. Elite teams prove that speed and stability are not trade-offs; they enable each other.
4. Change Failure Rate
Change Failure Rate (CFR) measures the percentage of deployments to production that result in a service degradation, incident, or require a rollback. This essential KPI for a software engineer directly assesses the stability and quality of the development process. A high CFR indicates that while a team might be shipping code quickly, it's doing so at the cost of reliability, leading to user-facing issues and increased operational toil.
This metric is one of the four key DORA metrics, popularized by Google's DevOps Research and Assessment team. It provides the crucial counterbalance to speed-focused KPIs like Deployment Frequency, ensuring that teams maintain stability as they accelerate delivery.
Why It's a Key KPI
A low Change Failure Rate is a hallmark of an elite engineering team. It demonstrates mature CI/CD practices, robust testing, and a high-quality review process. For managers, tracking CFR helps quantify the "cost" of poor quality and highlights systemic issues in the development pipeline. It shifts the conversation from "how fast can we go?" to "how can we go fast safely?".
How to Measure and Improve It
You can calculate this metric by dividing the number of deployments that caused a failure by the total number of deployments over a specific period. For example, if you had 2 failures out of 20 deployments in a month, your CFR would be 10%. DORA benchmarks classify elite performers as having a CFR of 0-15%.
Actionable Tips for Improvement:
*   **Implement Automated Testing:** Enforce comprehensive automated testing, including unit, integration, and end-to-end tests, as a prerequisite for merging code.
*   **Establish Quality Standards:** Create clear code review guidelines and checklists to ensure every PR is scrutinized for potential issues beyond just logic errors. Enhanced visibility from tools can help enforce these standards.
*   **Use Staged Rollouts:** Deploy changes incrementally using canary releases or feature flags. This allows you to monitor for issues in a small-blast radius and roll back easily before a full-scale failure occurs.
*   **Track Failure Root Causes:** When a failure occurs, perform a blameless post-mortem to identify the root cause. Use this data to fix the underlying process issue, not just the bug.
Key Insight: Change Failure Rate is a lagging indicator. To get ahead of it, focus on leading indicators like code review quality and test coverage. A stable, reliable system is built long before the code ever reaches production.
5. Mean Time to Recovery (MTTR)
Mean Time to Recovery (MTTR) is a critical reliability KPI for a software engineer that measures the average time it takes to restore service after a production failure is detected. From the moment an alert fires to the point the system is fully operational again, MTTR quantifies a team's ability to respond to, diagnose, and resolve incidents. It directly reflects the effectiveness of on-call processes, monitoring, and deployment pipelines.
This metric is a cornerstone of Google's Site Reliability Engineering (SRE) discipline and is widely promoted by incident management platforms like PagerDuty. It shifts the focus from preventing all failures (an impossible goal) to building resilient systems that can recover from them quickly.
Why It's a Key KPI
A low MTTR is a direct indicator of a mature and robust engineering practice. It shows that a team has effective monitoring to detect issues early, well-defined incident response playbooks, and a streamlined process for deploying fixes. For engineering leaders, tracking this KPI is essential for maintaining customer trust and service reliability, as prolonged downtime can lead to significant revenue loss and reputational damage.
How to Measure and Improve It
Calculate MTTR by taking the timestamp when a service is fully restored and subtracting the timestamp of the initial incident alert. Averaging this duration across all incidents in a period gives you the MTTR. Top-performing teams like those at Google Cloud often target an MTTR of under 5 minutes for critical services.
Actionable Tips for Improvement:
*   **Establish Incident Playbooks:** Create clear, step-by-step guides for common failure scenarios. This reduces cognitive load during a crisis and speeds up diagnosis.
*   **Expedite Hotfix Reviews:** A fix can be ready but blocked by a slow code review. Tools like [PullNotifier](https://pullnotifier.com/?utm_source=blog&utm_medium=referral&utm_campaign=kpi-software-engineer-guide-kpi-software-engineer-metrics-to-boost-performance) can be configured with rules to send urgent, high-priority alerts to specific channels or individuals for hotfix PRs, ensuring they are reviewed and merged in minutes, not hours.
*   **Invest in Alerting:** Fine-tune monitoring to provide actionable alerts with rich context. This helps engineers pinpoint the root cause faster instead of searching through logs.
*   **Enable One-Click Rollbacks:** Ensure your deployment system allows for fast, simple rollbacks to a previous stable version. This is often the quickest way to restore service while a permanent fix is developed.
Key Insight: MTTR is not just about developer speed; it reflects the entire system's health, including observability, deployment automation, and on-call culture. Improving it requires a holistic approach, not just pressuring engineers to code faster during an outage.
6. Code Review Coverage
Code Review Coverage measures the percentage of code changes that undergo a peer review before being merged into the main branch. This fundamental kpi for a software engineer acts as a critical quality gate, ensuring that no code bypasses human evaluation and that established standards are consistently applied. High coverage indicates strong engineering governance, promotes knowledge sharing, and reduces the risk of defects slipping into production.
This metric is a cornerstone of modern development practices, championed by organizations like Google and codified in platforms like GitHub. It focuses on process adherence, confirming that the collaborative safety net of peer review is applied to nearly all code modifications.
Why It's a Key KPI
High Code Review Coverage is a direct indicator of a mature and disciplined engineering culture. It ensures that every change benefits from multiple perspectives, which helps catch bugs, improve design, and mentor junior developers. For managers, tracking this KPI confirms that quality processes are being followed and helps identify teams or repositories that might be cutting corners, intentionally or not.
How to Measure and Improve It
You can calculate this metric by dividing the number of pull requests with at least one review by the total number of pull requests merged into a protected branch over a specific period. Aiming for 100% is the ideal, with a realistic target often set above 95%.
Actionable Tips for Improvement:
*   **Enforce Branch Protection:** Use built-in features in GitHub or GitLab to set up branch protection rules. Require at least one or two approvals before a PR can be merged into critical branches like `main` or `develop`.
*   **Automate Reviewer Assignment:** Eliminate the friction of finding a reviewer. Tools like [PullNotifier](https://pullnotifier.com/?utm_source=blog&utm_medium=referral&utm_campaign=kpi-software-engineer-guide-kpi-software-engineer-metrics-to-boost-performance) can automatically assign reviewers based on code ownership or team workload, ensuring reviews are distributed fairly and quickly.
*   **Track Coverage Trends:** Monitor this metric to ensure it stays high. A dip in coverage could signal a process breakdown or that a team is bypassing reviews for "minor" changes, which often introduce unintended side effects.
*   **Establish a Hotfix Process:** Create a clear, documented exception process for emergency hotfixes. This prevents teams from disabling protections and ensures that even urgent changes receive post-merge review.
Key Insight: Code Review Coverage isn't just about catching bugs; it's a primary mechanism for team-wide learning and knowledge transfer. When 100% of code is reviewed, every developer gains visibility into the entire codebase, breaking down knowledge silos and improving team resilience.
7. Code Quality Metrics (Defect Density)
Defect Density is a crucial quality metric that measures the number of confirmed defects or bugs per 1,000 lines of code (KLOC). This KPI for a software engineer offers a standardized way to assess the quality of a codebase before it reaches production. A high defect density can signal underlying issues with coding standards, testing practices, or the complexity of a particular module.
This metric has its roots in traditional software engineering quality assurance, advocated by institutions like IEEE and used in mission-critical environments like NASA. It provides a tangible measure of quality that can be tracked over time to gauge the effectiveness of process improvements.
Why It's a Key KPI
Tracking Defect Density helps teams shift quality control left, focusing on preventing bugs rather than just finding them in QA. It provides a direct feedback loop on the effectiveness of code reviews, static analysis, and unit testing. For engineering managers, a rising defect density trend is a clear indicator that technical debt may be accumulating or that a specific part of the system requires refactoring.
How to Measure and Improve It
You can calculate this metric by dividing the total number of defects found in a component by its size in KLOC (e.g., 10 defects in 2,000 lines of code = 5 defects/KLOC). Benchmarks vary, but high-quality code often has fewer than 2 defects per KLOC, while safety-critical systems aim for less than 0.5.
Actionable Tips for Improvement:
*   **Establish Coding Standards:** A clear style guide and set of coding standards reduce common, preventable errors, lowering the baseline defect count.
*   **Integrate Static Analysis:** Use tools like SonarQube or ESLint to automatically catch bugs, code smells, and vulnerabilities before a human reviewer even sees the pull request.
*   **Leverage Review Checklists:** Guide reviewers to look for specific types of defects systematically. A well-structured [code review checklist](https://pullnotifier.com/tools/code-review-checklist?utm_source=blog&utm_medium=referral&utm_campaign=kpi-software-engineer-guide-kpi-software-engineer-metrics-to-boost-performance) ensures consistency and thoroughness.
*   **Correlate and Analyze:** Track defect trends against projects or teams to identify hot spots. A module with consistently high defect density may be a candidate for a major refactor or additional automated test coverage.
Key Insight: Defect Density should never be used to evaluate individual developer performance. Its true value lies in assessing process effectiveness and identifying systemic risks within the codebase, not in creating a culture of blame.
8. Developer Productivity Index
The Developer Productivity Index is a composite KPI for a software engineer that blends multiple quantitative and qualitative signals to create a holistic view of their contribution. Instead of focusing on a single output like lines of code, this index typically combines metrics such as PRs submitted, code review participation, commits, and issue resolution. The goal is to move beyond simple output and measure an engineer’s overall impact on the team and codebase.
This approach acknowledges that valuable engineering work isn't just about writing new code. It includes mentoring through reviews, improving existing systems, and collaborating on complex problems. It has gained traction through platforms like GitLab and GitHub, which provide dashboards that track a wide array of developer activities beyond just commits.
Why It's a Key KPI
A well-constructed Developer Productivity Index helps engineering managers identify high performers and recognize different contribution styles. One engineer might be a feature-shipping machine, while another excels at unblocking others through high-quality, fast code reviews. This KPI helps quantify both types of impact, preventing a culture that only rewards "hero coders." It provides a more balanced and fair assessment of an engineer's performance. For more insights on this topic, you can explore this guide to engineering productivity measurement.
How to Measure and Improve It
Creating an index involves selecting a few key metrics and weighting them based on team values. For example, you might assign points for each PR merged, each meaningful review comment left, and each critical bug fixed. Summing these points over a period gives you an individual's productivity score.
Actionable Tips for Improvement:
*   **Balance Output and Collaboration:** Ensure your index weights collaborative activities heavily. For example, make participation in code reviews as valuable as submitting a PR to encourage a culture of mutual support.
*   **Track Individual Trends:** Use the index to monitor an engineer’s personal trends over time rather than making direct comparisons between individuals. A declining score might signal burnout or a blocker.
*   **Use for Coaching, Not Judging:** This KPI is best used as a tool for developmental conversations and coaching. Tying it directly to compensation or performance reviews can encourage metric-gaming.
*   **Identify Bottlenecks:** Use metrics from tools like PullNotifier to see if external factors, like slow review times from others, are impacting an individual's productivity score.
Key Insight: The power of a Developer Productivity Index lies in its customization. Tailor the included metrics and their weights to reflect what your team truly values, whether it's raw innovation, code quality, mentorship, or a balance of all three.
9. Test Coverage and Automated Test Pass Rate
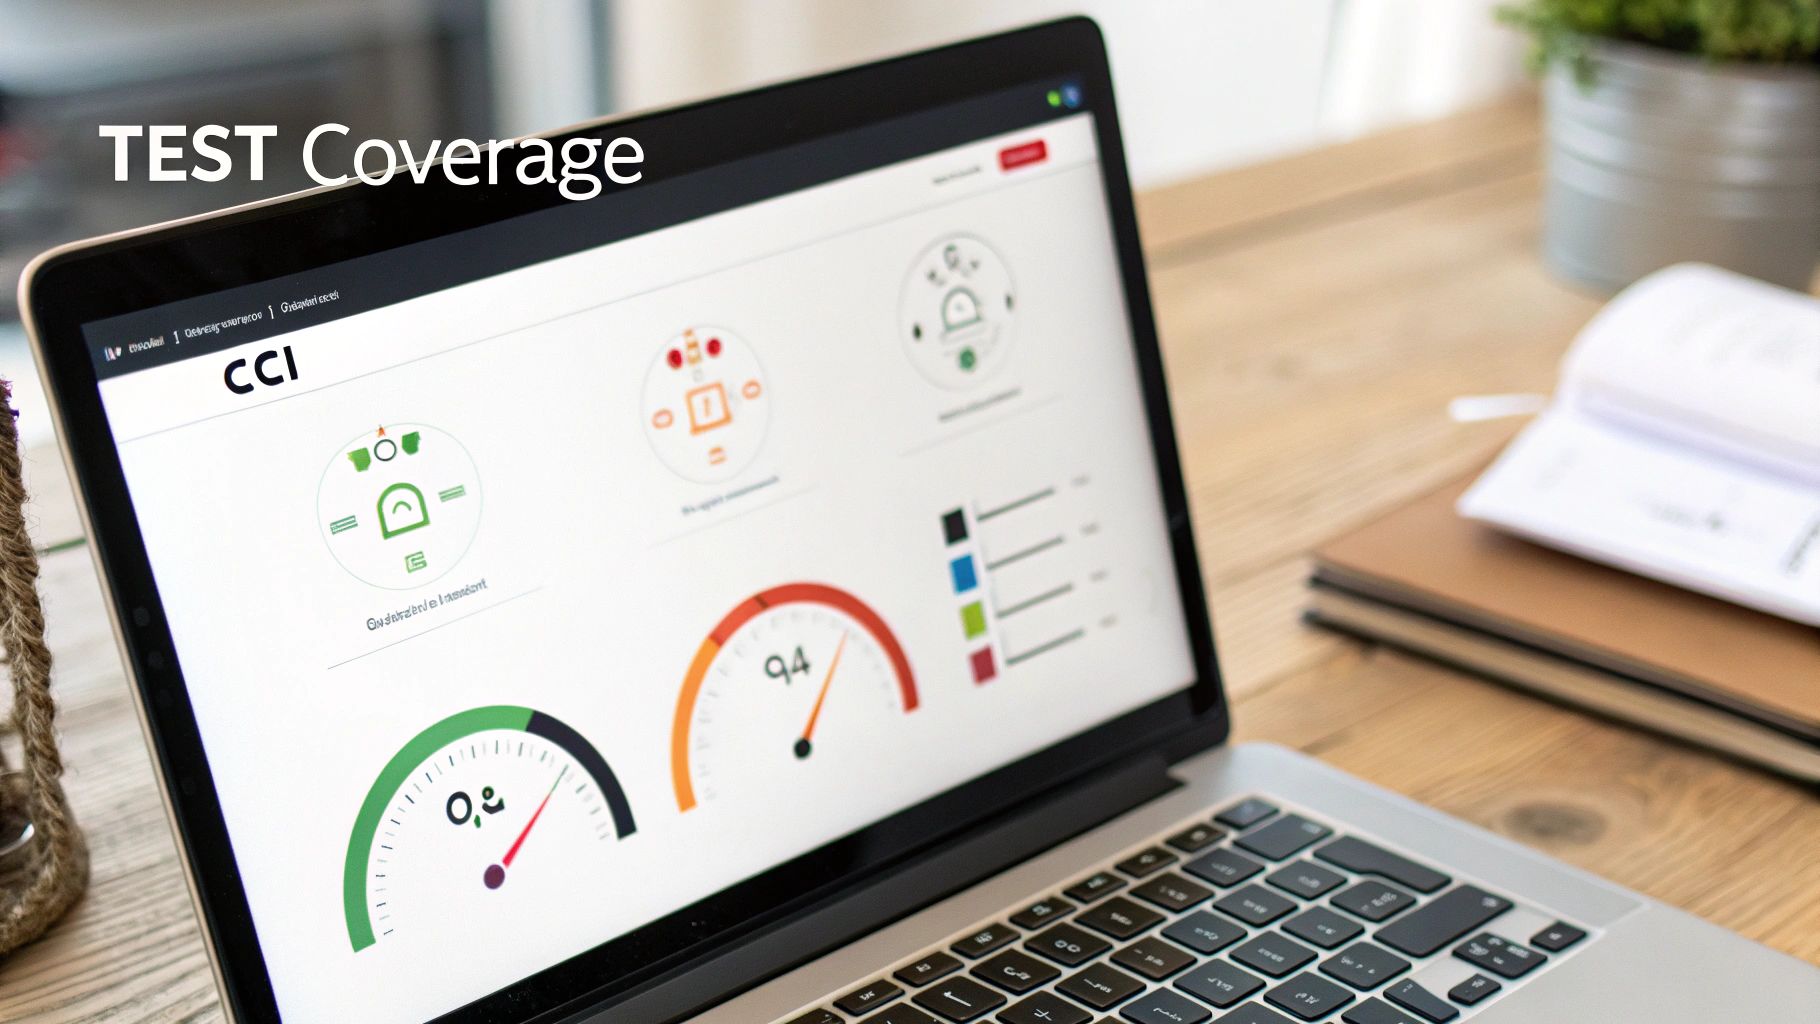
Test Coverage measures the percentage of a codebase exercised by automated tests, while the Automated Test Pass Rate tracks the percentage of those tests that succeed during CI builds. Together, these metrics form a critical quality gate, offering a quantitative look at code reliability and the robustness of the team's testing practices. A high test coverage percentage indicates that most of the code has been validated, while a high pass rate confirms that new changes haven't introduced regressions.
This dual KPI is a cornerstone of modern Continuous Integration and Continuous Delivery (CI/CD) practices, heavily promoted by platforms like SonarQube and embedded into the workflows of companies like Stripe, which often requires >75% coverage and a 100% test pass rate for merges.
Why It's a Key KPI
These metrics provide an objective measure of confidence in the codebase. High coverage and pass rates directly correlate with a lower Change Failure Rate, as potential bugs are caught early in the development cycle rather than in production. For any software engineer, these KPIs reflect a commitment to quality and professionalism, while for managers, they help de-risk deployments and ensure engineering standards are met.
How to Measure and Improve It
Most modern CI tools and code analysis platforms (like Codecov or SonarQube) automatically calculate these metrics on every pull request. Test Pass Rate is simply the number of passed tests divided by the total number of tests executed.
Actionable Tips for Improvement:
*   **Set Gated Check-ins:** Enforce minimum coverage thresholds (e.g., 80%) and a 100% test pass rate as mandatory checks in your CI pipeline before a PR can be merged.
*   **Automate Test Failure Alerts:** Flaky or failing tests can block the entire team. Use tools like [PullNotifier](https://pullnotifier.com/?utm_source=blog&utm_medium=referral&utm_campaign=kpi-software-engineer-guide-kpi-software-engineer-metrics-to-boost-performance) to send immediate Slack notifications to the PR author or designated team channel when a test suite fails, prompting a quick resolution.
*   **Track Coverage Trends:** Don't just look at the absolute number; monitor the trend. Coverage should ideally never decrease. Set up your CI to fail a build if a new PR reduces overall test coverage.
*   **Balance Your Test Pyramid:** Aim for a healthy mix of unit, integration, and end-to-end tests. High coverage with only unit tests can create a false sense of security. To develop these skills further, individuals might consider a [Certified Software Tester Professional course](https://getcourse.com.au/courses/LL-Certified-Software-Tester-Professional) to master comprehensive testing strategies.
Key Insight: Test coverage is a measure of what code your tests execute, not what they verify. Aim for meaningful assertions, not just line coverage. A 100% coverage score is meaningless if the tests don't actually validate the correct behavior.
10. Knowledge Sharing and Code Review Participation
Knowledge Sharing and Code Review Participation is a crucial software engineer KPI that measures how review responsibilities are distributed across a team. Instead of focusing on speed, this metric tracks who participates in reviews, how evenly the load is spread, and whether the process fosters mentorship. It shifts the view of code reviews from a simple quality gate to a powerful mechanism for organizational learning and reducing knowledge silos.
This approach is a cornerstone of the engineering culture at companies like Google and is heavily influenced by research on psychological safety. High-performing teams use it to actively mitigate "bus factor" risk, ensuring no single developer becomes a bottleneck or a single point of failure.
Why It's a Key KPI
Tracking review participation highlights the health of a team's collaborative fabric. An uneven distribution, where one or two seniors handle all reviews, indicates knowledge hoarding and potential burnout. Conversely, a broad and balanced participation signals a resilient, cross-functional team where knowledge flows freely, and junior members are actively mentored. For managers, this KPI provides a direct view into team dependencies and growth opportunities.
How to Measure and Improve It
Measure this by analyzing the distribution of review comments and approvals across all team members over a given period. Tools that integrate with your version control system can generate reports showing participation rates per engineer, helping you spot imbalances.
Actionable Tips for Improvement:
*   **Establish Reviewer Rotation:** Implement a formal or informal system to rotate who reviews which parts of the codebase. This prevents expertise from being concentrated in one person.
*   **Pair Junior and Senior Reviewers:** Intentionally assign a senior and a junior engineer to the same pull request. This creates an invaluable, hands-on mentoring opportunity.
*   **Use Smart Assignment Tools:** Tools like [PullNotifier](https://pullnotifier.com/?utm_source=blog&utm_medium=referral&utm_campaign=kpi-software-engineer-guide-kpi-software-engineer-metrics-to-boost-performance) can implement custom routing rules that automatically suggest or assign a diverse set of reviewers, preventing developers from always defaulting to the same senior expert.
*   **Celebrate High-Quality Feedback:** Publicly recognize team members who provide exceptionally helpful, constructive, and educational feedback during code reviews to reinforce positive behaviors.
Key Insight: The goal isn't just equal participation; it's about intentional knowledge transfer. Use this KPI to ensure that code reviews are actively making the entire team stronger and more knowledgeable, not just catching bugs. A healthy review culture is a learning culture.
Top 10 Software Engineer KPIs Comparison
| Metric | 🔄 Implementation Complexity | ⚡ Resource Requirements & Speed | 📊 Expected Outcomes | 💡 Ideal Use Cases | ⭐ Key Advantages |
|---|---|---|---|---|---|
| Code Review Velocity | Low–Moderate — PR tracking + notifications | Low resources; ⚡ significantly improves response time | Faster first reviews; reduced dev cycle time | High-traffic repos, distributed teams, SLA enforcement | 4⭐ Faster responses; easy to measure |
| Pull Request Cycle Time (Lead Time for Changes) | Moderate — end-to-end instrumentation required | Moderate resources (CI/CD + metrics); ⚡ shortens lead time when optimized | Holistic reduction in lead time; higher deployment frequency | Teams pursuing DORA improvements and end-to-end flow optimizations | 5⭐ Holistic, benchmarkable impact |
| Deployment Frequency | High — requires robust CI/CD and pipelines | High infra investment; ⚡ enables rapid releases when automated | Increased time-to-value; faster user feedback loops | Continuous-delivery orgs, feature-flag driven releases | 5⭐ Enables rapid, low-risk delivery |
| Change Failure Rate | Moderate — needs incident attribution & tracking | Monitoring and incident-management resources; impacts stability | Lower incident/rollback rates; improved reliability | Services requiring balance of speed and safety (finance, infra) | 4⭐ Clear quality/stability signal |
| Mean Time to Recovery (MTTR) | Moderate — incident processes, runbooks, tooling | On-call, alerting, rollback tools; ⚡ measures response speed | Faster incident resolution; improved customer trust | Critical production systems with tight SLAs | 4⭐ Faster recovery; operational maturity |
| Code Review Coverage | Low–Moderate — branch rules and reviewer workflows | Requires reviewer capacity; may slow merges if understaffed | Higher governance, audit trails, knowledge sharing | Regulated systems or teams enforcing strict review gates | 4⭐ Ensures consistent reviews and compliance |
| Code Quality Metrics (Defect Density) | Moderate — defect tracking + normalization by LOC | Tooling (static analysis, bug trackers); improves detection speed | Identification of high-risk areas; fewer downstream defects | Long-lived or safety-critical codebases | 4⭐ Directly highlights quality hotspots |
| Developer Productivity Index | High — composite metric design and weighting required | Data aggregation and tooling; risk of gaming metrics | Visibility into contribution patterns; coaching insights | Team coaching, capacity planning, non-compensation reviews | 3⭐ Broad productivity insight when well-designed |
| Test Coverage & Automated Test Pass Rate | Moderate — CI integration and coverage tooling | Test compute cost; ⚡ strong gate for safe merges | Fewer regressions; confident refactoring and deployments | Teams with mature CI aiming to reduce change failures | 5⭐ Strong quality gate; prevents regressions |
| Knowledge Sharing & Review Participation | Low–Moderate — participation tracking and routing rules | Time investment for mentoring; tooling to distribute reviews | Reduced bus factor; increased cross-team knowledge | Onboarding, growth-stage teams, reducing single points of failure | 4⭐ Improves knowledge distribution and mentoring |
From Measurement to Mastery: Building a Culture of Continuous Improvement
Navigating the landscape of software engineering metrics can feel like charting a course through a dense fog. However, the ten key performance indicators detailed in this guide, from Pull Request Cycle Time to Code Quality and Deployment Frequency, serve as your compass and map. They are not merely numbers on a dashboard; they are the narrative of your team's process, highlighting strengths, revealing bottlenecks, and pointing the way toward greater efficiency and stability.
The journey from simply measuring these KPIs to truly mastering them is about shifting from a culture of oversight to one of empowerment. A successful kpi software engineer strategy isn't about micromanaging lines of code or tracking individual activity. Instead, it’s about providing teams with a shared language and objective data to discuss their work, celebrate progress, and collectively solve problems. When an engineer can see how their code review velocity impacts the team's overall cycle time, they become an active participant in improving the entire development lifecycle.
Synthesizing Velocity, Quality, and Stability
The most powerful takeaway is the need for a balanced approach. Focusing solely on velocity metrics like Deployment Frequency can lead to burnout and a decline in quality. Conversely, an overemphasis on stability metrics like Change Failure Rate can stifle innovation and slow down progress. The true mark of a high-performing engineering organization is its ability to find the equilibrium between these forces.
- Velocity (Speed): Metrics like PR Cycle Time and Deployment Frequency gauge your team's ability to deliver value quickly.
- Quality (Excellence): KPIs such as Defect Density and Test Coverage ensure that what you're delivering is reliable and maintainable.
- Stability (Resilience): Change Failure Rate and Mean Time to Recovery (MTTR) measure your system's robustness and your team's ability to respond to incidents effectively.
By tracking a holistic set of indicators across these three pillars, you create a system of checks and balances that fosters sustainable growth rather than short-term gains.
Your Actionable Path Forward
Transforming data into action is where real change happens. The goal is to move beyond passive observation and build a proactive rhythm of continuous improvement. Here are your next steps to make these software engineer KPIs work for your team:
- Start Small and Focused: Don't try to implement all ten KPIs at once. Choose two or three that align with your team's most pressing challenges. If slow delivery is a problem, start with Pull Request Cycle Time and Code Review Velocity. If production incidents are a concern, focus on Change Failure Rate and MTTR.
- Establish a Baseline: You can't improve what you don't measure. Spend a few sprints gathering data to understand your current performance. This baseline will be the benchmark against which you measure all future improvements.
- Empower, Don't Prescribe: Present the data to your team and facilitate a conversation. Ask questions like, "What do these numbers tell us?" and "What experiments can we run to improve this?" Let the team own the solutions. This fosters a sense of agency and accountability that is far more effective than top-down mandates.
- Integrate Metrics into Your Workflow: The most effective KPIs are those that are visible and actionable in the tools your team uses every day. This is where purpose-built solutions become invaluable. Tools like PullNotifier can surface PR-related metrics directly within your communication channels, turning abstract data points into timely, contextual nudges that drive better habits without disrupting flow.
Ultimately, the most important KPI is progress itself. By embracing this data-informed approach, you are not just optimizing code; you are building a more resilient, collaborative, and effective engineering culture. You are empowering every kpi software engineer on your team to become a master of their craft and a driver of organizational success.
Ready to make your engineering metrics visible, actionable, and seamlessly integrated into your team's workflow? PullNotifier automates the tracking and reporting of critical pull request KPIs, delivering real-time insights directly in Slack to help you reduce cycle times and improve collaboration. Start your free trial today and turn your data into a catalyst for continuous improvement at PullNotifier.