- Published on
Mastering Engineering Efficiency Metrics
- Authors

- Name
- Gabriel
- @gabriel__xyz
Engineering efficiency metrics are just a fancy way of saying "numbers that tell you how healthy, fast, and solid your software development process is." They give you objective data on team performance, which is incredibly useful for spotting bottlenecks, getting better at predicting delivery times, and making sure your engineering work actually lines up with what the business needs.
Why Tracking Efficiency Is Not Micromanagement
Think of a Formula 1 pit crew. Every single action is timed and every movement is dialed in—not to punish anyone, but to make the whole process faster and more reliable. That’s exactly what engineering efficiency metrics do for software teams. They're not a tool for breathing down people's necks; they're the dashboard that shows you the health of your development engine.
Without these metrics, teams are often flying blind, going with their gut to guess how things are going. This can lead to blown deadlines, a mountain of technical debt, and a huge gap between what engineers are building and what the business actually values. By measuring key parts of the development lifecycle, you turn a bunch of raw data into insights you can actually use.
From Subjective Feelings to Objective Facts
The whole point of these metrics is to have conversations based on data, not feelings. Instead of saying, "It feels like code reviews are taking forever," you can say, "Our average Pull Request Review Time has jumped by 20% this quarter. Let's dig into why." This switch from subjective hunches to objective facts is what builds a culture of continuous improvement.
Bringing this data-driven approach into your team has some clear wins:
*   **Identifying Bottlenecks:** You can pinpoint exactly where things are getting stuck, whether it's the testing phase, deployment, or somewhere else.
*   **Improving Predictability:** You get a much clearer picture of how long it takes to ship value, which makes setting realistic timelines way easier.
*   **Enhancing Team Collaboration:** Shared data helps the team talk about fixing the process, not blaming individuals.
*   **Aligning with Business Goals:** You can finally see if all that hard work is translating into real results for the company and its customers.
The goal is to measure the system, not the people. Good engineering metrics shine a light on the friction in your process, so teams can work together to find solutions that make everyone's job smoother and more impactful.
The Foundation of Engineering Excellence
At the end of the day, tracking the right numbers is the key to unlocking consistent, sustainable performance. It's about creating a feedback loop where teams can see the real-time impact of the changes they make to their process. This approach actually empowers engineers by giving them ownership over their own workflows and the tools to make them better.
As you start down this path, it's good to know the difference between efficiency and raw productivity. For a deeper dive, check out our guide to engineering productivity measurement. Measuring efficiency is all about working smarter, not just harder, and making sure every ounce of effort goes into building amazing software that customers love. It's the bedrock of a resilient, high-performing engineering team.
The Core Metrics Every Engineering Team Should Track
If you want to understand your team's performance, you need more than just a gut feeling. You need a dashboard with clear, actionable gauges. These are your core engineering efficiency metrics, and they're what separate data-driven decisions from guesswork. Think of them not as tools for judgment, but as diagnostic instruments for improving the health of your entire development system.
Just like a doctor checks vital signs—heart rate, blood pressure, temperature—to get a quick read on a patient's health, engineering leaders use a specific set of metrics to understand their software delivery process. These numbers show you where the team is firing on all cylinders and where friction is slowing things down.
Bottlenecks are the traffic jams of your development engine. They kill predictability and stall the delivery of value to your customers. Identifying and clearing them is the name of the game.
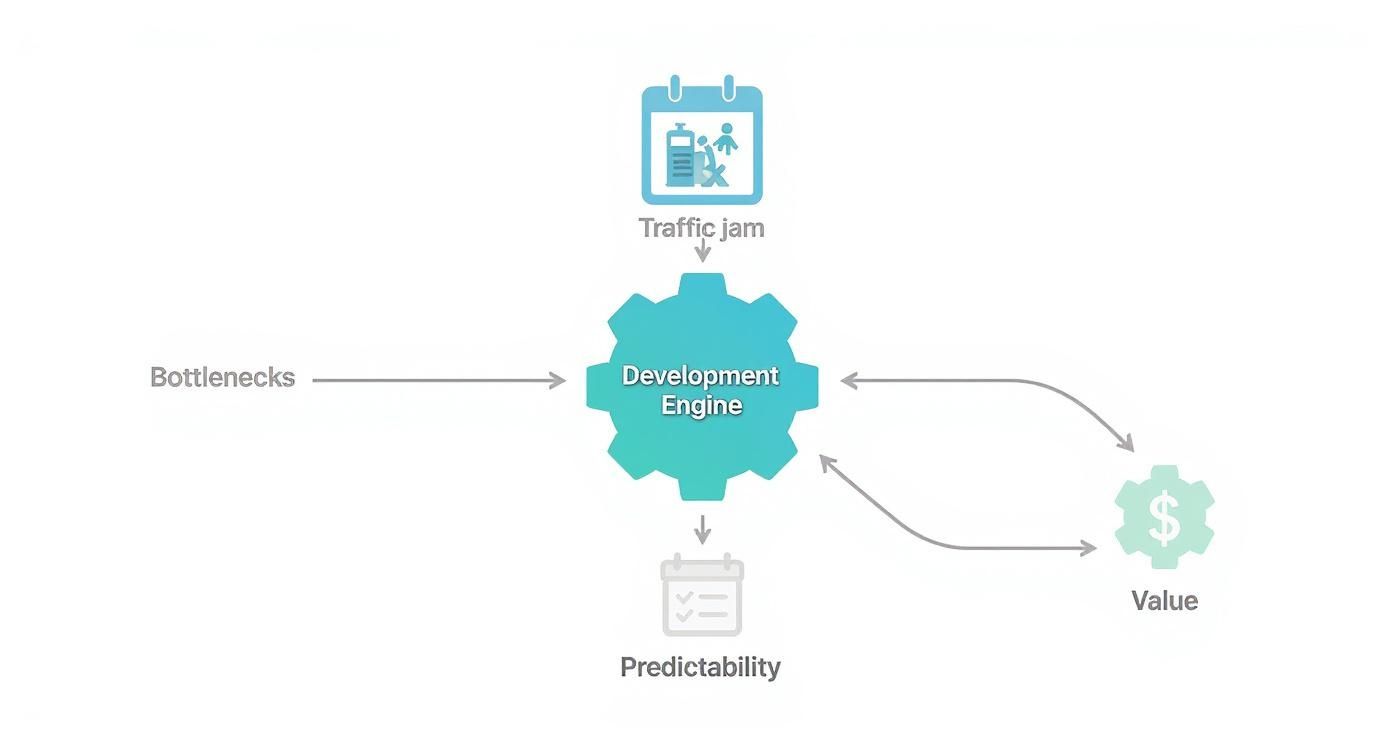
As the diagram shows, a smooth workflow is key to hitting deadlines and making a real impact. Resolving those blockages is how you build a consistent, high-performing team.
Before we dive into the specific metrics, here’s a quick overview of the most critical ones you should consider tracking.
Key Engineering Efficiency Metrics at a Glance
| Metric | What It Measures | Why It Matters |
|---|---|---|
| DORA Metrics | The four key indicators of speed and stability (Deployment Frequency, Lead Time, MTTR, Change Failure Rate). | Provides a holistic, outcome-focused view of your team's DevOps performance. |
| Cycle Time | The time from the first commit on a task to its deployment in production. | Reveals internal bottlenecks and process inefficiencies within your workflow. |
| PR Review Time | The time a pull request waits for review and gets merged after being opened. | Acts as a barometer for team collaboration and highlights review process friction. |
| Throughput | The number of work items (stories, PRs, etc.) completed in a given period. | Helps understand team capacity and makes future planning more predictable. |
| Work-in-Progress (WIP) | The number of tasks currently being worked on by the team. | High WIP often leads to context switching and burnout; limiting it improves focus. |
| Rework Rate | The percentage of code that needs to be rewritten shortly after deployment. | Signals issues with requirements, quality checks, or testing processes. |
This table serves as a great starting point, but let's break down what these metrics really tell you and how to use them effectively.
The DORA Metrics Gold Standard
A great place to start is with the metrics made famous by the DevOps Research and Assessment (DORA) team. They’ve become the industry gold standard for a reason: they give you a balanced view of both speed and stability—two sides of the same high-performance coin.
*   **Deployment Frequency:** How often does your team successfully ship code to production? Elite teams often deploy multiple times a day. A high frequency is a sign of a healthy, automated pipeline that supports small, low-risk changes.

*   **Lead Time for Changes:** This tracks the time from a code commit all the way to that code running successfully in production. It’s a direct measure of your delivery speed. A short lead time means you can respond to customer needs and market shifts in a flash.

*   **Mean Time to Recovery (MTTR):** When something breaks in production, how long does it take to fix it? MTTR is a critical indicator of your system’s resilience and your team's ability to troubleshoot under pressure.

*   **Change Failure Rate:** What percentage of your deployments cause a production failure, like a service outage or a rollback? A low rate points to high quality and robust testing.
DORA metrics are powerful because they measure outcomes, not just output. They tell you how effectively your team is delivering value and maintaining stability—the ultimate goals of any engineering organization.
Digging Deeper with Process-Oriented Metrics
While DORA metrics give you the 30,000-foot view, other metrics let you pop the hood and see what's happening inside the engine. These are essential for diagnosing the root causes of any issues your DORA metrics might flag.
Cycle Time: Uncovering Hidden Delays
Cycle Time is one of the most powerful metrics for process improvement. It measures the time from when work actually starts on a task (the first commit) to when it’s done (deployed to production). Think of it as the stopwatch for your internal development workflow.
A long cycle time is a blaring siren that you have a bottleneck. By breaking it down into its phases—like coding time, review time, and testing time—you can pinpoint exactly where work is getting stuck. Is it sitting in a queue waiting for review? Blocked in QA? These insights are gold for making targeted improvements.
Pull Request Review Time: A Barometer for Collaboration
Pull Request (PR) Review Time measures how long it takes for a PR to get reviewed and merged after it’s opened. This metric says a lot about your team’s collaboration and workflow. Long review times can signal a few different problems:
*   PRs are too big and complex, making them a chore to review.
*   The team culture doesn’t prioritize reviewing code.
*   There aren't enough available reviewers who have the right context.
Slow reviews act like a drag chute on the entire system. Developers are left waiting, context switching piles up, and momentum grinds to a halt. We dig into this and other related indicators in our guide on key metrics for faster code reviews in GitHub.
In 2025, tracking these metrics is no longer optional. Across software engineering, deployment frequency and lead time are king. In manufacturing, they're focused on throughput and first pass yield. The principles are the same: measure to improve.
Additional Vital Signs for Team Health
Beyond the core speed and collaboration metrics, a few others will give you a more complete picture of your team’s operational health and focus on quality.
Throughput measures the number of tasks (like stories, bugs, or PRs) your team completes in a given period. It helps you understand your team's capacity and delivery cadence, which makes future planning far more predictable.
Work-In-Progress (WIP) tracks how many tasks are currently being worked on. High WIP is a classic productivity killer. It forces context switching, invites distractions, and leads to burnout. Limiting WIP is a foundational principle of Agile and Lean for a good reason—it forces focus and gets things done.
For teams using specific stacks like Ruby on Rails, specialized Ruby on Rails Performance Services are often brought in to fine-tune applications, and their work relies heavily on these same performance indicators.
Rework Rate shows you the percentage of code that has to be rewritten shortly after being deployed. It’s often a sign of unclear requirements or flimsy quality checks. High rework is just wasted effort that could have been spent building something new.
By tracking a balanced set of these engineering efficiency metrics, you get a multi-dimensional view of your team's performance. This data empowers you to have constructive, evidence-based conversations about what’s working, what isn’t, and how you can get better together.
For years, the software world was obsessed with one number: velocity. Teams measured their worth by how many story points they could burn through in a sprint. Hitting a high number felt like winning, but this approach has a massive blind spot—it measures output, not outcome.
Chasing velocity is like rewarding a factory for churning out a mountain of products nobody wants to buy. It pushes teams to game the system by inflating estimates and prioritizing quantity over quality. The real question isn't "How much did we build?" but rather, "Did we build the right thing, and did it actually deliver any value?"
This realization is driving a fundamental shift in how we think about engineering efficiency metrics. Smart teams are ditching abstract points for tangible, value-driven measurements that connect their work directly to customer and business impact.
From Story Points to Time to Value
Out of this shift, a powerful new indicator has emerged: Time to Value (TTV). This metric tracks the entire journey from the spark of an idea to the moment a customer actually benefits from it. TTV is the ultimate answer to the question, "How quickly can we solve a real problem for our users?"
Unlike cycle time, which just looks at the internal development process, TTV covers the entire value stream:
*   **Idea Generation:** The time spent in product discovery and validation.
*   **Design and Planning:** The effort to scope and design a solution.
*   **Development and Delivery:** The cycle time to build, test, and deploy the feature.
*   **Customer Adoption:** The point where users start engaging with and benefiting from the new functionality.
Focusing on TTV naturally pulls everyone together. It’s no longer just an engineering problem; product, design, and marketing all have a critical role to play in shrinking that timeline.
Balancing Performance with People
Of course, a purely data-driven approach can be toxic if it forgets about the people doing the work. The goal isn't to burn out your most valuable asset—your engineers. It's to build a sustainable, high-performing system. A true measure of efficiency has to account for developer well-being.
Take context switching, for example. It's a silent killer of both productivity and morale. When engineers are constantly yanked between meetings, unplanned work, and their core tasks, focus shatters and burnout isn't far behind. Tracking metrics around interruptions and unplanned work can shine a light on deep-seated process issues that are hurting both your team's health and its efficiency.
A healthy engineering culture uses metrics to improve the system, not to micromanage individuals. The aim is to remove friction and frustration, creating an environment where developers can do their best work without burning out.
This more holistic view is catching on. In 2025, engineering leaders are moving beyond traditional metrics to focus on sustainable, context-aware productivity. They're starting to measure how often engineers are interrupted, what percentage of their work aligns with strategic goals, and the depth of mentorship from senior team members. You can dig deeper into this and other engineering metric trends on Revelo.com.
In the end, the most effective engineering efficiency metrics tell a complete story. They show not just how fast you're going, but whether you're heading in the right direction—and doing it in a way that supports a healthy, engaged, and innovative team. It’s not just about building faster; it’s about building better.
Implementing Your Measurement Plan Step-By-Step

Alright, let's move from theory to reality. Actually putting a measurement plan in place can feel like a huge task, but it’s really just a series of small, deliberate steps. The goal isn't to track every number you can possibly find from day one. It's about slowly building a data-informed culture where engineering efficiency metrics act as a compass for improvement, not a club for judgment.
Think of it like getting a new fitness tracker. You don't start by obsessing over heart rate variability and deep sleep cycles. You start with the basics—steps and hours slept—to get a simple, clear picture of where you are right now. The same idea applies here.
Start with Purpose and Pick Your Metrics
Before you measure a single thing, you have to know why you're measuring it. What specific problem are you trying to solve? What question are you trying to answer? A vague goal like "we want to be more efficient" isn't going to get you anywhere.
A much better goal is specific and actionable, like: "We have a hunch our code review process is a bottleneck, and we want to reduce our PR Cycle Time." Now you have a clear starting point. With your "why" defined, pick a small, focused set of metrics—no more than two or three—that directly map to that goal.
If your focus is on speed and finding bottlenecks, these are great metrics to start with:
*   **Cycle Time:** To see the full journey from the first commit to deployment.
*   **Pull Request Review Time:** To zoom in on that potential collaboration slowdown.
*   **Deployment Frequency:** To track how often you’re actually shipping value.
Starting small keeps you from getting buried in data and helps the team focus on improving one specific area. You can always add more metrics as you get comfortable.
Establish Your Baseline and Automate Collection
Once you’ve picked your metrics, the next critical step is to get a baseline. You can’t know if you’re getting better if you don't know where you started. Let your measurement tools run for a few weeks or a full sprint without changing a thing in your process. This gives you an honest snapshot of your current performance.
This baseline is your source of truth. It's the starting line against which all your future efforts will be measured.
And this part is non-negotiable: the data collection must be automated. Tracking this stuff manually is a recipe for disaster. It’s tedious, full of errors, and sends the wrong message to the team—that metrics are just more busywork. Tools that plug right into your version control (like GitHub) and project management software (like Jira) are essential.
Automation makes sure your data is consistent, accurate, and gathered without adding another task to your engineers' plates. It frees up the team to focus on what actually matters: analyzing the insights and figuring out how to improve.
Visualize Data and Foster Blame-Free Conversations
Raw numbers in a spreadsheet are boring and hard to understand. The real power of engineering efficiency metrics is unlocked when you visualize them on shared dashboards that the whole team can see. A simple line chart showing the trend of Cycle Time over the last month is infinitely more powerful than a table of raw data.
These dashboards create a shared reality and a sense of collective ownership. They become the centerpiece for data-driven conversations, especially during team retros. When you talk about the data, the focus must always be on the process, not the people.
Instead of asking, "Why was your PR review so slow?" try framing it this way: "Our team's average PR Review Time went up this sprint. What systemic issues might have caused this? Were the PRs too big? Were key reviewers swamped with other work?"
This approach builds psychological safety and turns problem-solving into a team sport. When teams see metrics as a tool to spot and fix shared frustrations, they'll jump on board. For some concrete ideas, you can explore proven strategies to reduce cycle time in our 2025 guide.
By repeating this cycle—measure, analyze, discuss, and adapt—you’ll build a resilient, high-performing engineering culture that’s always getting better.
How AI Is Reshaping Engineering Efficiency
Artificial intelligence isn't some far-off concept anymore; it's a real tool that's already changing how software gets built. AI assistants and automated tooling are becoming a standard part of a developer's day-to-day, making a direct impact on core engineering efficiency metrics.
These tools are designed to take the grunt work off a developer's plate, from spinning up boilerplate code to flagging potential bug fixes. This frees up engineers to spend their brainpower on the tough, creative problems, which can slash development cycles in a big way.

For instance, tools like PullNotifier now use AI to summarize complex pull requests, speeding up the entire code review process. This is a perfect example of how a targeted AI feature can directly shrink PR Review Time, a key piece of your overall Cycle Time.
Beyond the Hype: Measuring Real AI Impact
All the chatter about AI creating the "10x engineer" kind of misses the point. The real win with artificial intelligence is how it enhances human skill, not how it replaces it. Think of it as a super-powered assistant, speeding up all the manual, repetitive tasks that used to eat up so much time.
But just throwing AI tools at your team won't magically make things better. To know if they're actually working, you have to measure their effect on your existing engineering metrics. Is your Cycle Time actually getting shorter? Has your Deployment Frequency ticked up? Is the Rework Rate dropping because AI is helping you catch mistakes earlier?
The goal isn't just to use AI; it's to use it effectively. Tracking metrics provides the necessary feedback loop to determine the real-world ROI of your AI investments and separates genuine productivity gains from mere novelty.
To truly understand the benefits, it's essential to explore the measurable impact of context engineering AI, focusing on specific performance indicators and data-driven insights. This approach ensures you're making informed decisions about which tools deliver real value.
Quantifying AI-Driven Productivity Gains
The industry is pouring money into this space, and the data explains why. A 2025 engineering industry survey found that while 61% of companies hiked up their engineering budgets, only about 20% of teams were actively using metrics to track the impact of their AI tools.
Despite this gap, 67% of leaders expect AI to boost their team's velocity and productivity by at least 25%. And the numbers back them up: engineers who fully embrace AI tools are getting work done 30-50% faster than their peers. You can find more of these insights in the 2025 software engineering management trends on Jellyfish.co.
This points to a massive opportunity. The teams that will pull ahead are the ones who not only adopt AI but also use engineering efficiency metrics to sharpen their strategy. This is where modern Software Engineering Intelligence (SEI) platforms become indispensable. They provide the dashboards needed to connect the dots between AI tool adoption and actual performance gains, helping you answer the all-important question: "Is this new tool actually making us faster?"
By measuring before and after, teams can finally prove the value of their AI investments and fine-tune how these tools fit into their workflow.
Got Questions About Engineering Metrics?
Stepping into the world of engineering efficiency metrics always brings up some good questions. It's totally normal to wonder about how the team will react, where to even begin, and what mistakes to sidestep. Let's walk through some of the most common questions to help you build a solid, healthy metrics program from the ground up.
The whole point is to treat measurement as a tool for making everyone's work life better, not for putting people under a microscope.
Which Metrics Are Best to Start With?
For most teams dipping their toes in the water, the four DORA metrics are the perfect starting point: Deployment Frequency, Lead Time for Changes, Mean Time to Recovery (MTTR), and Change Failure Rate. They give you a well-rounded picture of both your speed (Frequency and Lead Time) and your stability (MTTR and Failure Rate). This combo is great because it stops you from chasing speed at the cost of quality, or the other way around.
Once you’ve got a good feel for those outcome-focused metrics, bringing in Cycle Time is the natural next step. It zooms in on your internal development process, helping you find the exact spots where things get stuck between the first commit and the final deployment.
The most important thing? Start small. Pick just a few key metrics, get a clear baseline, and make sure the whole team understands why you're tracking them—for process improvement, not for performance reviews.
How Can We Track Metrics Without Micromanaging?
This is the big one, and getting it right is all about communication and focus. The golden rule is to be crystal clear about your goal: you are measuring the system, not the people. Frame the whole thing as a team effort to find and fix the bottlenecks that frustrate everyone.
To back this up, stick to looking at team-level trends only—never individual stats. Under no circumstances should these metrics ever find their way into a performance review. The moment data is used as a weapon, it becomes useless for actual improvement.
Put the data out in the open on shared dashboards for everyone to see. Use these charts to kick off collaborative, no-blame discussions in retros. When engineers see metrics as a practical way to make their own jobs easier and more productive, they’ll start to see them as a valuable tool for the team.
What Are Some Common Pitfalls to Avoid?
The single biggest mistake is getting fixated on one metric. This almost always backfires. For example, if you become obsessed with cranking up Deployment Frequency, you might just watch your code quality take a nosedive as everyone rushes to ship.
Here are a few other classic blunders to keep an eye out for:
*   **Comparing Teams or Individuals:** Don't ever use metrics to create leaderboards. Every team operates in its own unique world, with its own charter, technical debt, and experience. Direct comparisons are just unfair and will crush morale.
*   **Using Vanity Metrics:** Stay away from numbers that look pretty on a chart but have zero connection to real business value. "Lines of code written" is the poster child for this—it tells you nothing about impact or quality.
*   **Setting Arbitrary Targets:** Don't just pull goals out of thin air, like "we need to cut cycle time by **50%** next quarter." Instead, figure out your baseline and work *with the team* to set realistic, small-step improvement goals based on what the data is telling you.
The end goal should always be continuous, sustainable improvement that the team drives itself—not just hitting some number handed down from on high.
Ready to surface the metrics that matter and eliminate review bottlenecks? PullNotifier integrates seamlessly with GitHub and Slack to provide clear, actionable updates on your pull requests, helping you slash PR Review Time and improve your team's Cycle Time. See how it works and get started for free.