- Published on
Mastering kpi software development: The Essential Guide to Impactful Metrics
- Authors

- Name
- Gabriel
- @gabriel__xyz
When you hear "KPIs" in software development, what comes to mind? Too often, it’s a jumble of metrics used to measure the effectiveness, quality, and speed of engineering teams. But it's more than just data. Done right, KPIs act as a data-driven compass, guiding your strategic decisions, flagging hidden bottlenecks, and making sure your team’s hard work actually lines up with what the business needs.
Moving Beyond Misleading Development Metrics
For years, engineering leaders have been staring at dashboards filled with numbers that look impressive but say almost nothing about real performance. Metrics like "lines of code written" or "number of commits" are the perfect examples of vanity metrics. They track activity, not impact. Think about it: a developer could churn out a thousand lines of messy, inefficient code, blowing up their stats while piling on technical debt. This kind of measurement just encourages a culture of busywork, not results.
The cost of measuring the wrong things is huge. Teams get stuck optimizing for meaningless numbers, they start to distrust the data entirely, and real problems like burnout or systemic roadblocks go completely unnoticed. Real progress isn't about how busy everyone looks; it's about shipping valuable features smoothly and sustainably.
Shifting Focus from Activity to Outcomes
A modern take on KPI software development means stepping away from individual output and looking at the health of the entire delivery system. Instead of asking, "How many tickets did we close this week?" we should be asking, "How fast can we get an idea from a whiteboard into the hands of our users?" This shift requires a whole new set of metrics—ones centered on flow, quality, and stability.
"High-performing teams don’t just measure more. They measure better. They focus on the signals that align teams, improve delivery, and support continuous improvement, not vanity metrics or busywork."
This philosophy is exactly what frameworks like the DORA (DevOps Research and Assessment) metrics are all about. These four key indicators—Deployment Frequency, Lead Time for Changes, Mean Time to Recovery, and Change Failure Rate—give you a balanced view of both speed and quality. They're the foundation for a much healthier and more effective way to measure success.
Finding the Right Metrics for Your Team
Choosing the right KPIs is what separates meaningful improvement from data overload. To make sure your team is focused on what actually drives progress, it's worth taking the time to understand the agile performance metrics that truly matter. The goal isn't to track everything under the sun. It's to pick a handful of indicators that give you actionable insights into your team's specific challenges and goals.
The Most Impactful KPIs for Engineering Teams
If you want to get a real handle on performance, you have to look past surface-level activity. True KPI software development isn't about tracking every click and keystroke; it's about zeroing in on a handful of metrics that tell you about the health and speed of your entire system. These are your compass, not your speedometer—they guide you toward real improvements, not just busywork.
The gold standard for any modern engineering metrics program is the DORA framework. These four metrics give you a balanced view of both speed and stability, which is why the highest-performing teams live by them.
The Four Pillars of High Performance: DORA Metrics
What makes DORA so powerful is that it measures outcomes, not just output. It’s like a vital signs monitor for your entire delivery pipeline.
- Deployment Frequency: How often do you successfully ship code to production? A high frequency is a great sign. It usually means you have a solid, automated pipeline and a culture of making small, incremental changes—which dramatically lowers risk.
- Lead Time for Changes: This is the clock from a developer's first commit all the way to that code running in production. It’s a direct measure of your process efficiency. Shorter lead times mean you're getting value to users faster. Simple as that.
- Mean Time to Recovery (MTTR): When something inevitably breaks in production, how long does it take you to fix it? A low MTTR points to a resilient system and a team that can firefight effectively.
- Change Failure Rate: What percentage of your deployments cause a production failure, like an outage or a rollback? A low rate is a clear indicator of strong quality practices and overall system stability.
By focusing on these four areas, teams can achieve both speed and quality without sacrificing one for the other. They are the essential vital signs for your engineering organization's health.
This concept map really brings it home. It shows the shift from misleading vanity metrics that just track activity to modern metrics like DORA that give you a true compass for performance.
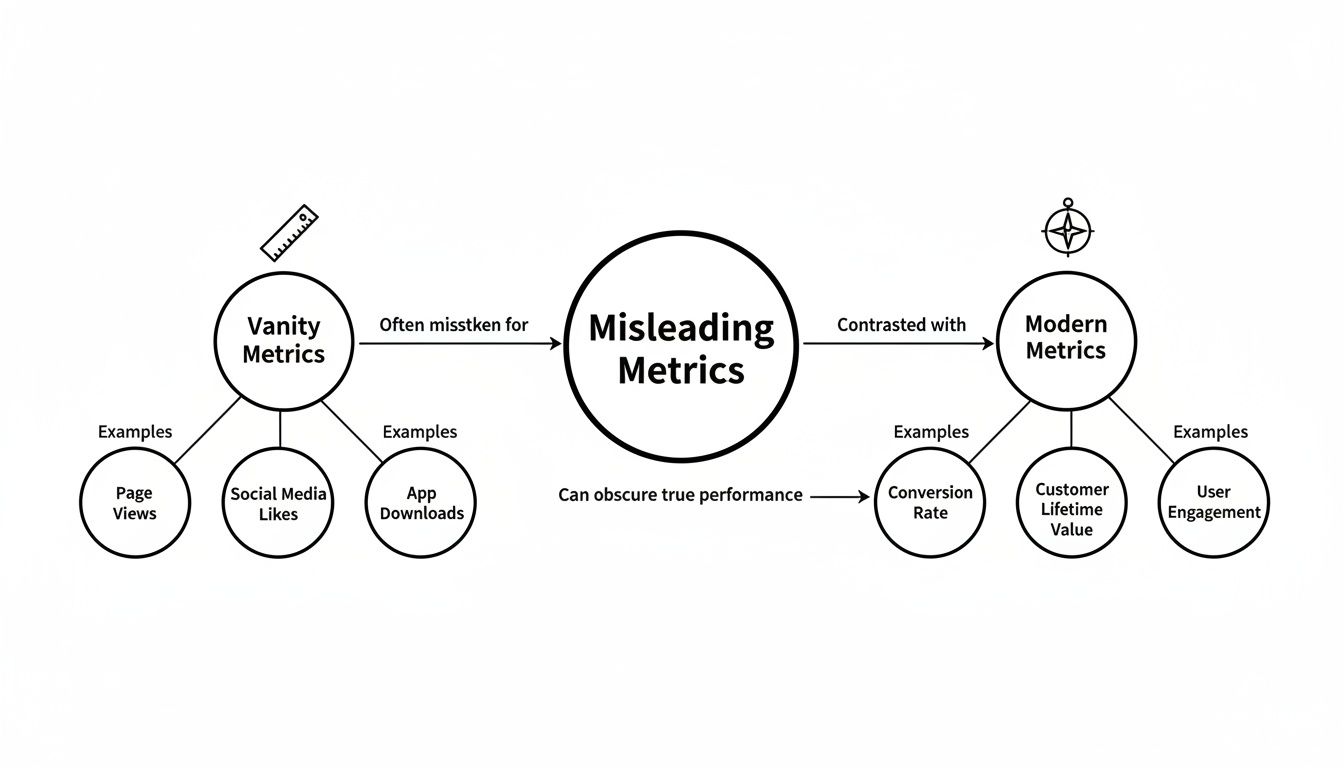
The takeaway here is simple: vanity metrics are like a ruler measuring volume, but modern metrics are a compass giving you direction. They help you navigate toward real business impact.
Diagnosing Your Workflow with Process Metrics
While DORA gives you the 30,000-foot view, process metrics are your magnifying glass. They help you zoom in and diagnose the specific bottlenecks and friction points that are slowing your team down.
Cycle Time
Cycle Time is one of the most powerful diagnostic tools you have. It measures the total time from the moment work starts on a task (think: first commit) until it's live in production. It’s the full, end-to-end journey for a piece of work.
A long cycle time is almost always a symptom of a deeper issue. Is code sitting in review for days on end? Is the QA process a black hole? By breaking down cycle time into its different stages—coding, review, testing, deployment—you can pinpoint exactly where the delays are happening. A great first step in improving engineering productivity measurement is to get a handle on this metric.
Pull Request Size
The size of a pull request (PR) has a massive, direct impact on your entire workflow. Big PRs are a nightmare to review, a pain to test, and introduce a much higher risk of bugs. They create cognitive overload for reviewers and often just sit there, clogging up the whole pipeline.
Keeping PRs small and focused is a cornerstone of efficient development. A small PR that does one thing is easy to understand, quick to review, and much safer to merge. This one practice can drastically shorten your review times and, as a result, your overall Cycle Time.
Pull Request Review Time
PR Review Time tracks how long it takes from the moment a pull request is opened until it's finally merged. This metric often exposes a huge, hidden source of delay. When PRs just languish in a "waiting for review" state, developers lose momentum, context-switch to other tasks, and the whole delivery timeline gets stretched out.
Digging into public GitHub data reveals a pretty stark reality. While the median pull request is surprisingly small, the wait time for more complex changes can be enormous. An analysis of over 10,000 public GitHub pull requests found that while the median PR changes just 3 files and adds 21 lines of code, the wait time per line of code can balloon to over 22 hours for complex changes. It's wild. Those delays on just a few large PRs can absolutely torpedo your team's velocity.
This is where a slick review process, helped by smart tooling, becomes a game-changer. For example, a tool like PullNotifier cuts through the notification noise by sending targeted, real-time alerts to the right reviewers in Slack. By killing the time PRs spend sitting idle, you can directly attack one of the biggest drivers of long cycle times.
By pairing high-level DORA metrics with targeted process KPIs like Cycle Time and PR Review Time, you build a powerful framework for continuous improvement. You can see the health of your system from a distance and still have the diagnostic tools to fix problems on the ground.
Choosing the Right KPIs for Your Role
Software development metrics aren't a one-size-fits-all solution. Their real value is all about perspective. Think of it like a car's dashboard: the driver needs to know the speed and fuel level, but the mechanic is focused on oil pressure and engine temperature. They're both looking at the same car, but they need different information to do their jobs.
The exact same thing happens with software development KPIs. A metric that gives an engineering manager a critical insight might just be noise for an individual developer. To make KPIs useful, you have to tailor them to the specific goals and daily grind of each person on the team. This turns abstract data into a practical tool that actually helps people improve.
KPIs for Engineering Managers
Engineering managers are looking at the big picture—the health of the team and the entire system. Their main job is to build an efficient and predictable delivery engine. They need metrics that give them a high-level view of the workflow, helping them spot bottlenecks and track trends over time.
For managers, the best KPIs measure the flow of value and the overall health of the team's process.
*   **Cycle Time:** This is the ultimate health check. It tracks the total time from the first commit all the way to production, giving a complete picture of team velocity. A consistently low or shrinking cycle time is a great sign that things are running smoothly.
*   **Deployment Frequency:** A core DORA metric, this tells you how often the team successfully ships value to users. High frequency is a strong signal of an agile, low-risk release process powered by a healthy, automated pipeline.
*   **Work In Progress (WIP):** This tracks how much work is being juggled at any given moment. High WIP is a classic recipe for context switching, which kills focus and blows up cycle times. Managers use this to spot and relieve multitasking overload.
KPIs for Developers
Developers are in the trenches, living inside the code and the review process every single day. The best KPIs for them aren't about tracking output but about smoothing out the daily friction that gets in their way. Their focus is on the nitty-gritty of their workflow.
Metrics that shine a light on slowdowns in the development loop are gold for developers.
*   **PR Review Time:** How long does a pull request just sit there, waiting for a teammate's feedback? Long review times are a huge source of frustration and delay, forcing developers to switch context while their work goes stale. This is where tools like [PullNotifier](https://pullnotifier.com/) come in, sending smart alerts to reviewers to slash that idle time and keep momentum going.
*   **Rework Rate:** This metric shows the percentage of code that gets rewritten or changed shortly after it was committed. A high rework rate can point to fuzzy requirements, weak testing, or technical debt, giving developers the data they need to argue for better processes.
When developers focus on process metrics like review time, they take ownership of their team's efficiency. The conversation shifts from "How much did you code?" to "How can we make our process smoother for everyone?"
KPIs for QA Engineers
Quality Assurance engineers are the guardians of stability and reliability. Their KPIs should help them see the quality of the development process before code hits production and measure the impact of anything that slips through the cracks.
*   **Change Failure Rate:** What percentage of deployments cause a production failure? This DORA metric is a direct measure of release quality and tells you how effective your entire testing and review pipeline really is.
*   **Escaped Defects:** This simply tracks the number of bugs that users find in production. It’s a clear signal of how well your pre-release quality gates are working and helps QA figure out where to beef up test coverage.
KPIs for Product Owners
Product Owners are the bridge between engineering work and business results. They need to know how the team's delivery performance is creating real value for customers and the company. Their metrics connect the world of code to strategic goals.
*   **Lead Time for Changes:** While it sounds like Cycle Time, this DORA metric is more aligned with product planning. It measures the time from when a feature is requested (or added to a sprint) to its delivery. This helps product owners give more accurate timelines and keep stakeholders happy.
*   **Feature Adoption Rate:** After a feature is shipped, how many users are actually using it? This KPI directly links the engineering team's output to customer value, making sure all that development effort is focused on work that truly matters.
How to Implement a KPI Tracking Framework
Successfully rolling out a KPI program is more about psychology than technology. If your team sees it as a surveillance tool, they’ll resent it. The key is to frame your new KPI software development framework as a collaborative tool for solving problems, not a system for judging individuals.
This shift in perspective turns metrics from a source of fear into a shared language for getting better. When everyone knows the goal is to find and fix bottlenecks in the system, not point fingers, you build a culture of trust and continuous improvement.
Start with Team Buy-In
Before you even think about dashboards, you need to get your team on board. The only way to do that is by getting them involved from day one.
Kick things off with an open conversation. Talk about the real challenges the team is facing—maybe it’s slow code reviews, unpredictable release cycles, or a frustrating amount of rework. Then, introduce KPIs as a way to get objective data on those specific pain points.
When engineers help define what "healthy" looks like, they engage more deeply. Shared ownership is the foundation of a successful KPI implementation and builds the buy-in you need for long-term success.
This collaborative approach makes sure the metrics you pick are actually relevant to the team's daily work and feel helpful, not intrusive.
Select a Small, Focused Set of Metrics
Don't try to boil the ocean. One of the fastest ways to kill a new KPI initiative is by overwhelming your team with dozens of charts and graphs. Instead, start small. Pick a handful of high-impact metrics that directly address your most pressing problems.
A great starting point is to choose one or two key metrics from different categories:
*   **For Flow:** **Cycle Time** is often the best single metric to start with. It measures the entire process from first commit to production, making it a powerful indicator of your system’s overall health. To learn more, check out these [7 proven strategies to reduce cycle time in 2025](https://blog.pullnotifier.com/blog/7-proven-strategies-to-reduce-cycle-time-in-2025).
*   **For Stability:** **Change Failure Rate** gives you a direct measurement of quality and shows how effective your testing and review processes really are.
*   **For Speed:** **Deployment Frequency** is a clear signal of your team's agility and the health of your CI/CD pipeline.
By starting with a small, manageable set of KPIs, you give your team a chance to build confidence and see the value of the data without feeling buried by it.
Automate Data Collection and Establish a Rhythm
Manually tracking KPIs is a recipe for disaster. It’s tedious, error-prone, and quickly becomes a chore nobody wants to do. The only sustainable way forward is automation.
Use tools that plug directly into your existing systems like GitHub, GitLab, and Jira. This ensures data is collected consistently and accurately in the background, without adding any manual work for your team.
Once you have the data flowing, the next step is to establish a regular rhythm for reviewing it. This is where the real value comes in.
- Integrate KPIs into Retrospectives: Don't create separate "metrics meetings." Instead, bring the KPI data right into your existing sprint retrospectives.
- Ask Better Questions: Use the data as a conversation starter, not a verdict. Instead of saying, "Our cycle time is too high," ask, "What do we think contributed to the longer cycle time on these particular stories?"
- Focus on Trends, Not Absolutes: A single data point is just noise. The real insights come from looking at trends over time.
Once your framework is in place, understanding effective KPI reporting strategies is crucial for making it stick. This consistent rhythm of review and discussion is what turns raw data into real improvements and a healthier, more predictable development process.
How AI Is Reshaping Software Development KPIs

AI coding assistants like GitHub Copilot aren't just a novelty anymore—they're becoming a standard part of the modern developer's toolkit. They're changing how code gets written, and the kpi software development metrics we use to measure success need to change right along with them.
The impact is already showing up in the data. An Accenture study found that teams using GitHub Copilot saw an 8.69% increase in pull requests per developer and an 11% jump in PR merge rates. What’s really eye-opening is that successful builds shot up by a massive 84%, which suggests AI doesn't just make coding faster; it also improves the quality of that initial code.
While all this extra productivity sounds great on paper, it shines a spotlight on a new and critical challenge: the code review process is now under more pressure than ever before.
The New Bottleneck AI Creates
Imagine your development pipeline is a highway. AI assistants just added a bunch of new on-ramps, letting developers generate code and open pull requests faster than ever. It’s a huge win for the “coding” part of your Cycle Time.
But all that new traffic eventually merges into the same toll plaza—the code review. If you don't expand the plaza, you get a massive traffic jam. Reviewers get swamped, PRs sit idle, and all the speed you gained from AI gets completely wiped out by review delays.
Suddenly, the efficiency of your code review process isn't just another part of the workflow. It becomes the main thing controlling your team's overall speed and a critical focus for any modern KPI software development strategy.
Adapting Your KPIs for the AI Era
To really benefit from AI-driven productivity, your team’s focus has to shift. The game isn't just about writing code faster anymore. It's about getting that code reviewed and merged with the same speed and quality. This means a few key process metrics just became way more important.
*   **PR Review Time:** This metric is now front and center. You absolutely have to track the time from when a PR is opened to when it gets its first review and its final merge. It’s the only way to spot the slowdowns.
*   **PR Size and Complexity:** AI can generate a lot of code, fast. Keeping an eye on PR size is crucial for reinforcing the habit of creating small, manageable changes that are way easier (and faster) to review.
*   **Reviewer Workload:** It's vital to make sure the review burden is spread out evenly. Overloading your senior devs just creates a single point of failure and leads straight to burnout.
At the end of the day, the AI era demands more than just faster coding. It requires hyper-efficient review systems and smart tools to handle all the extra volume. Things that streamline review notifications, like PullNotifier, are no longer a nice-to-have. They’re essential for keeping up your velocity and quality.
Using Smart Tools to Streamline Your Code Review Process

As AI assistants and automated workflows start cranking up the volume of pull requests, the code review process has become the single biggest lever you can pull to improve your most important software development KPIs. The speed and quality of your reviews directly ripple out to affect everything from Cycle Time to developer morale. Yet, a lot of teams are still stuck fighting a chaotic storm of GitHub notifications, which leads to missed reviews and painful delays.
Think about the typical "before" scenario. A developer pushes a PR and then... they wait. And wait. The notification gets buried in a sea of other alerts, and the reviewer is deep in another task, completely oblivious. That idle time is a silent killer of productivity, stretching out delivery timelines and forcing developers into constant, frustrating context switching.
From Bottleneck to Accelerator
Now, let's picture the "after": a team using a smart notification tool. When a new PR is opened, the right reviewer instantly gets a clean, actionable alert in a dedicated Slack channel. No noise, no confusion. The PR gets picked up in minutes, not hours or days.
This one simple shift completely changes the dynamic. By cutting out the dead time where pull requests just sit there, teams directly shorten one of the most unpredictable parts of the entire development lifecycle.
By focusing on the code review process, you aren’t just optimizing a single step; you are accelerating the entire flow of value from idea to production. It's the highest-impact area for improving your core delivery metrics.
An analysis of over 40 million pull requests underscores just how urgent this is. It found that 1 in 7 PRs now involves an AI agent—that’s a 14x increase from earlier this year. When you combine that with the 5 million GitHub Actions workflows running daily, it's clear that streamlined review tools are no longer a nice-to-have; they're essential for managing the load. You can discover more about the state of AI in code review on pullflow.com.
Tools like PullNotifier are built to solve this exact problem, cutting through the noise to make sure PRs get immediate attention. For teams looking to master this critical stage, our guide to automated code reviews offers deeper strategies. This is how modern tooling turns the code review from a bottleneck into an accelerator.
Still Have Questions About Software KPIs?
Getting started with a new metrics strategy always kicks up a few questions. It's completely normal. Let's walk through some of the most common concerns engineering teams have when they first start measuring their work.
How Can We Start Measuring KPIs Without Buying New Tools?
You can actually start right now with the tools you already use every day. It's all about getting a baseline, not perfection.
For example, your Git history is a goldmine. Dig into your main branch logs in GitHub or GitLab to find deployment dates and calculate a rough Deployment Frequency. To get a feel for Cycle Time, just grab the timestamps from the first commit to the final deployment for a few recent features. It’s manual, sure, but it’s a powerful way to make the metrics real for your team and build a case for better tooling later.
Will Tracking KPIs Make My Developers Feel Micromanaged?
This is probably the most important question to get right, and it's a very real concern. The secret is to make it crystal clear that these metrics are about improving the system, not scrutinizing individuals.
Focus on team-level metrics like average PR review time or overall cycle time—never on individual stats like lines of code written.
Bring the entire team into the conversation from day one. Let them help choose the KPIs you track. When you review the data together in retrospectives, it stops feeling like surveillance and starts feeling like a collaborative way to find and fix bottlenecks. That's how you build trust.
Which Single KPI Should We Start With If We're Feeling Overwhelmed?
If you can only pick one, make it Cycle Time.
Why? Because it tells the whole story, from the very first line of code committed all the way to that code running in production. It’s the ultimate health check for your entire development process.
When you focus on shrinking your Cycle Time, good things just start to happen. Your team naturally looks for ways to speed up reviews, automate testing, and smooth out deployments. It's one metric that forces improvements across the entire board, making it the highest-impact place to start.
Ready to slash your Cycle Time by clearing out code review bottlenecks? PullNotifier sends smart, real-time PR alerts in Slack, cutting through the noise so your team can merge faster. See how it works.