- Published on
Mastering software development kpi: Metrics that accelerate delivery and quality
- Authors

- Name
- Gabriel
- @gabriel__xyz
A software development KPI (Key Performance Indicator) is just a fancy term for a number that helps you track how well your engineering team is doing. Think of them like the dashboard in your car—they give you critical feedback on speed, health, and potential problems, so you can make smart decisions instead of just guessing.
What Are Software Development KPIs and Why They Matter
Trying to run a software team without clear metrics is like sailing a ship without a compass. Sure, you're moving, but are you going in the right direction? How fast are you going? Are you about to hit an iceberg? This is where a few well-chosen software development KPIs become your best friend.
These metrics cut through the vague feelings of "being productive" and give you hard data on what's actually happening. They help you answer the tough questions that keep engineering leaders and developers up at night:
*   **Are we shipping value to users quickly and reliably?**
*   **Is the quality of our code getting better or worse over time?**
*   **Where are the hidden bottlenecks slowing down our entire process?**
*   **Is the team burning out because of a lopsided workload?**
By tracking the right KPIs, teams get a clear picture of their entire workflow, from the first line of code all the way to deployment. This data-driven approach turns decision-making from a gut-feel exercise into an objective, evidence-based process. For a deeper look into this topic, check out our guide on engineering productivity measurement.
The Business Imperative for KPIs
The stakes for shipping software efficiently have never been higher. The global software development market is projected to hit $741 billion in 2025, which puts immense pressure on teams to deliver quality products without wasting time or resources. This growth shows just how central software has become to modern business, making performance measurement a must-have, not a nice-to-have.
To give you a quick lay of the land, here’s a simple breakdown of the main KPI categories you’ll encounter.
Quick Overview of Key Software Development KPI Categories
| KPI Category | What It Measures | Example Metric |
|---|---|---|
| Velocity & Throughput | The rate at which a team delivers completed work. | Cycle Time |
| Quality & Reliability | The stability and correctness of the software in production. | Change Failure Rate |
| Efficiency & Flow | How smoothly work moves through the development process. | Pull Request Review Time |
| Team Health & Engagement | The well-being and satisfaction of the developers. | Developer Satisfaction |
This table just scratches the surface, but it helps frame the different lenses through which you can view your team's performance. Each category tells a different part of the story.
KPIs are not about micromanaging developers or turning engineering into a soulless numbers game. They are about empowering teams with the insights they need to spot friction, celebrate real progress, and build a culture of continuous improvement.
At the end of the day, software development KPIs are all about connecting the hard work your engineering team does to tangible business outcomes. They create a shared language for developers, managers, and stakeholders to talk about performance, set goals that actually matter, and drive improvements that help everyone win. They make sure your most valuable resource—your engineers—are focused on building great products, not fighting preventable process problems.
The Four Pillars of Engineering Performance: DORA Metrics
If you're trying to measure software development performance, it's easy to get lost in a sea of metrics. Thankfully, a set of four key indicators, known as the DORA metrics, has emerged as the gold standard for truly understanding engineering effectiveness. These four pillars give you a balanced view of both team speed and system stability.
Think of DORA metrics like the vital signs for your engineering organization. A doctor wouldn't just check your heart rate and call it a day; they look at blood pressure, temperature, and breathing, too. Similarly, DORA metrics work together to give you a holistic picture of health, making sure a win in one area doesn't create a problem in another. They help answer the fundamental question: "How well are we actually delivering value to our users?"
A solid KPI framework isn't just about tracking numbers—it's about creating a feedback loop that gives you visibility, helps you make better decisions, and drives real improvement.
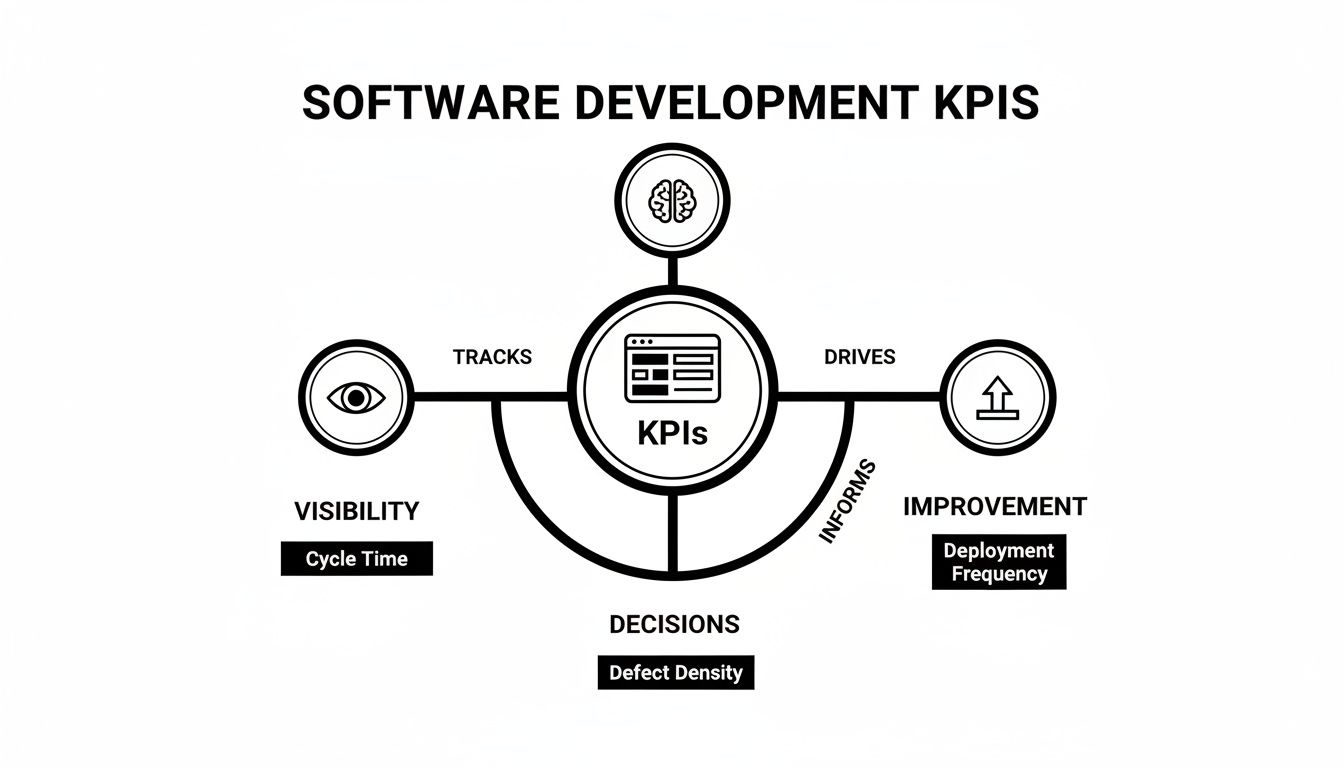
As you can see, the goal is to create a cycle of positive change fueled by data, not just to fill a spreadsheet.
Deployment Frequency
This metric is all about your team's tempo. Deployment Frequency tracks how often you successfully release code to production. It’s a direct signal of your team's agility and its capacity to get new features, bug fixes, and improvements out the door and into the hands of users.
Picture a factory assembly line. High deployment frequency is like a line that’s constantly and smoothly shipping finished products. This doesn't mean pushing huge, risky batches—quite the opposite. It means shipping small, incremental changes often.
*   **What it measures:** The rate of finished work making it to production.
*   **Why it matters:** Higher frequency usually means smaller, lower-risk deployments and a much faster feedback loop from your users.
*   **Data sources:** CI/CD pipeline logs, version control history (like Git tags).
A high deployment frequency is a hallmark of a mature, automated delivery process.
Lead Time for Changes
While deployment frequency tells you how often you ship, Lead Time for Changes tells you how long it takes to get there. Specifically, it measures the time from the first commit on a branch to that code being successfully deployed in production. It’s a critical metric for understanding the efficiency of your entire development workflow, from idea to reality.
A short lead time means your process is lean and efficient, with minimal time wasted in code reviews, testing, or deployment queues. In other words, when a developer says a feature is "done," how quickly can it actually start providing value to a customer? If you want to dive deeper, we have a guide on proven strategies to reduce cycle time, which is a key component of this metric.
Change Failure Rate
Speed without quality is just a fast way to break things. That's where Change Failure Rate (CFR) comes in, acting as the essential counterbalance to pure speed. It measures the percentage of your deployments that cause a problem in production and require a fix, like a rollback, hotfix, or patch.
CFR is the ultimate reality check for your development process. It tells you whether your pursuit of speed is compromising the stability and reliability that your users depend on.
A low change failure rate is proof that your quality gates—like automated testing and code review practices—are actually working. It shows you can move fast without breaking things.
Mean Time to Recovery
Look, no matter how great your processes are, failures in complex systems are inevitable. Mean Time to Recovery (MTTR) measures how long it takes your team to restore service after a production failure or incident hits. This KPI is a direct reflection of your team's resilience and operational excellence.
A low MTTR demonstrates that your team can diagnose issues, deploy fixes, and minimize downtime for users with incredible speed. It’s less about trying to prevent every single failure and more about building a system that can bounce back quickly when something goes wrong.
In today's world, balancing speed and security is the name of the game. Security has become a top concern for tech leaders, and as a result, more and more organizations are turning to DORA metrics to track developer experience. These KPIs have become indispensable because they help teams balance the need for velocity with critical security and quality requirements. Data-driven organizations are 3 times more likely to report improvements in their decision-making, which makes getting a handle on your KPIs more important than ever.
Measuring Code Quality and Process Health
While DORA metrics give you a fantastic high-level snapshot of your delivery pipeline, they don't tell the whole story. The most effective engineering teams know they need to dig deeper. They use specific KPIs to monitor the health of their codebase and uncover the hidden friction gumming up their internal processes. It’s all about shifting from a reactive stance to a proactive one.
Think of it like a pro athlete's training. Tracking race times—the DORA equivalent—is essential, but it’s not enough. Top athletes also monitor heart rate variability, sleep quality, and nutrition. Why? Because those metrics reveal the health of the system producing the results. Code quality and process health KPIs do the same for your engineering system.

Ignoring these internal health checks creates a blind spot. And it's an expensive one. Fixing bugs after release costs 25 times more than catching them during development. This forces teams to track not just deployment speed but also the quality of the code itself.
Decoding Your Development Workflow with Cycle Time
One of the most revealing process health metrics you can track is Cycle Time. It's related to DORA's Lead Time for Changes, but it zooms in on the active development phase—measuring the time from the first commit on a branch to its release in production. It’s a goldmine for spotting bottlenecks.
By breaking down Cycle Time into its core stages, you can see exactly where things are getting stuck:
*   **Coding Time:** How long it takes from the first commit until a pull request (PR) is opened. If this number is high, it could point to fuzzy requirements or a nasty patch of technical debt.
*   **PR Pickup Time:** The time a PR sits idle, waiting for its first review. This is often a huge, hidden delay that signals reviewer overload or a broken notification system.
*   **PR Review Time:** The duration from the first review comment to the final PR approval. Long review times can mean PRs are too large and complex, or your team lacks clear review guidelines.
Isolating these phases lets you move from a vague feeling that "things are slow" to pinpointing the exact part of your workflow that needs a tune-up.
Monitoring Codebase Stability and Churn
Beyond workflow speed, the stability of your codebase is everything. The metrics in this category are your early-warning system for declining quality and mounting technical debt.
Code Churn measures how often code gets rewritten or deleted shortly after it’s committed. A high churn rate isn't usually the sign of a "bad" developer. More often, it's a symptom of a systemic issue.
High code churn often acts as a smoke signal for deeper problems. It might mean that product requirements are ambiguous and constantly changing, or that developers are struggling to build on a foundation of significant technical debt.
Another vital quality metric is Bug Rate, which simply tracks how many defects pop up after a feature goes live. A few bugs are inevitable, but a consistently high or rising bug rate is a red flag. It suggests your quality gates, like automated testing or peer reviews, aren't cutting it.
These metrics help you navigate the tricky balance between shipping fast and maintaining a high-quality product. To dive deeper into this, check out our article on balancing code quality vs. delivery speed.
Leading vs. Lagging Indicators
To make your KPI program truly strategic, you have to understand the difference between two types of metrics.
*   **Lagging Indicators:** These report on past outcomes. Think project completion rates, customer-reported bugs, or budget variance. They tell you what *already happened*, but they don't give you much power to influence the future.
*   **Leading Indicators:** These metrics predict future outcomes. Examples include PR review time, PR size, and work-in-progress (WIP) limits. They give you a heads-up, a chance to intervene and course-correct before a problem snowballs.
For example, a consistently high PR review time (a leading indicator) is a strong predictor of a missed deadline down the road (a lagging indicator). By focusing on leading indicators, you empower your team to solve problems before they happen instead of just cleaning up the mess afterward.
Connecting KPIs to Real Workflow Improvements
Tracking software development KPIs is only half the battle. The real magic happens when you use that data to make tangible, positive changes to your team's day-to-day workflow. This is where theory meets practice.
It’s all about moving from simply watching a number on a dashboard to asking, "What process improvement is this number screaming at us to make?"
Think of it like a fitness tracker. Just knowing your heart rate is interesting trivia. But using that data to tweak your workout intensity is what actually makes you healthier. In the same way, seeing that your Cycle Time is high is the signal, not the solution. The crucial next step is to dig into the root cause and implement a specific fix.
This turns your metrics from passive reports into active tools for continuous improvement. It helps you build a smoother, faster, and more predictable development engine. Honestly, understanding these metrics is the first step in figuring out how to improve developer productivity.
From Problem to Solution: A Practical Framework
A simple but powerful way to link data to action is by thinking in terms of "Problem -> KPI Impact -> Solution." Let's walk through a common scenario that engineering teams run into all the time.
Scenario: The PR Traffic Jam
*   **The Problem:** Developers are complaining that their pull requests (PRs) sit gathering dust for days before anyone even looks at them. It's a massive bottleneck, work is piling up, and valuable context is lost with every passing hour.
*   **The KPI Impact:** This directly blows up your **PR Pickup Time** and, as a result, your overall **Cycle Time**. It also tanks developer morale—nothing's worse than feeling like your finished work is stuck in limbo.
*   **The Solution:** The root cause is almost always notification chaos. Default GitHub notifications are a firehose, getting lost in a sea of emails or drowned out in noisy Slack channels. The fix is to use a tool that delivers targeted, real-time PR updates right where your team already collaborates.
By getting the right notifications to the right reviewers at the right time, you can slash that idle waiting period.
Optimizing the Code Review Bottleneck
Let's be real: the code review process is often the single biggest point of friction in the entire development lifecycle. When things slow down here, it creates a massive ripple effect, wrecking everything from DORA metrics like Lead Time for Changes to process health KPIs like Cycle Time.
Many teams get stuck because their notification systems are either too loud or too quiet. Developers get spammed with so many irrelevant updates that they mute channels entirely, or they miss critical requests because there's no clear signal. It's this communication breakdown where a smarter tool can completely change the game.
When PRs stall in review, it’s rarely a people problem—it’s a process problem. Fixing the notification flow is one of the highest-leverage improvements an engineering team can make to accelerate their entire workflow.
For instance, a tool like PullNotifier integrates directly into Slack to cut through all that noise. Instead of an endless stream of updates, it delivers concise, actionable notifications. A reviewer gets a direct ping when a PR is assigned to them, and the entire team can track its progress in a single, consolidated thread.
This targeted approach stops context switching in its tracks and ensures PRs get the attention they need, exactly when they need it. The result? A much shorter PR Review Time and a faster, more efficient development cycle.
KPI Problems and Workflow Solutions
To make this even more concrete, here's a quick look at how common KPI-related problems map directly to practical workflow solutions, especially when you bring smarter communication into the mix.
| Common Problem | Affected KPI | Workflow Solution with PullNotifier |
|---|---|---|
| PRs sit idle waiting for the first review. | High PR Pickup Time, High Cycle Time | Automatically @mention relevant reviewers in a dedicated Slack channel the moment a PR is opened, ensuring it never gets lost. |
| Reviewers miss follow-up comments or approval requests. | High PR Review Time | Consolidate all PR activity—comments, approvals, requested changes—into a single, easy-to-follow Slack thread to maintain context. |
| Deployments are blocked by PRs awaiting final approval. | Low Deployment Frequency, High Lead Time for Changes | Send a final, high-priority notification to the channel when a PR is approved and ready to merge, signaling that the last step can be taken. |
This systematic approach creates a powerful feedback loop. You identify a pain point, see which software development KPI it's hurting, and then implement a targeted process or tool to fix it. This is how you move from just tracking numbers to actively refining your workflow, removing friction, and empowering your team to ship great code, faster.
How to Implement a Successful KPI Program
Launching a software development KPI program is about much more than just picking metrics and hooking up a dashboard. It’s a delicate cultural shift. Get it wrong, and it feels like surveillance, breeding resentment and encouraging teams to game the numbers. But get it right, and you empower everyone with the insights they need for genuine, continuous improvement.
Think of it like introducing a fitness plan to a sports team. If the coach just posts everyone’s stats on a leaderboard to shame the slowest runners, morale will plummet. But if that same coach uses individual data to build personalized training plans, celebrate personal bests, and spot injury risks, the whole team gets stronger, together. Your KPI program needs to be the supportive coach, not the intimidating judge.
Start with Why and Establish a Baseline
Before you track a single metric, you have to nail down the purpose. Frame the whole initiative around shared goals that engineers actually care about—like killing frustrating bottlenecks, protecting work-life balance by spotting burnout risks, or just shipping features more smoothly. The goal is to make life easier for developers, not to pile on more pressure.
Once you’ve got buy-in on the "why," the first practical step is to establish a baseline. Don't just pull arbitrary goals out of thin air. Instead, spend a few weeks or a full sprint just observing and measuring how things work right now. This gives you a realistic starting point and helps you see your unique workflow patterns as they are.
Set Realistic Team-Level Goals
With a baseline in hand, you can start setting goals. The key here is to set them at the team level, not for individuals. This approach fosters collaboration and makes it clear that success is a shared responsibility, not a cutthroat competition.
Here are a few principles for setting good goals:
*   **Focus on Leading Indicators:** Prioritize metrics that predict future success, like **PR Pickup Time** or **PR Size**. Nailing these directly improves lagging indicators like **Cycle Time**.
*   **Pick a Few Key Metrics:** Don't drown your team in a dozen different numbers. Start with two or three high-impact KPIs that are tied to a specific problem you’re trying to solve.
*   **Aim for Incremental Progress:** Instead of demanding a 50% improvement overnight, shoot for a realistic 10% reduction in review time. Small, consistent wins are what build momentum and confidence.
Don't forget to consider your team's tech stack. With 92% of developers now using AI tools in their workflows as of 2025, the old ways of working have changed. That means old-school metrics might not capture the full picture anymore. Your KPI program needs to evolve to measure how well your team is actually using these new tools to create value. Discover more insights about these software development trends.
Common Anti-Patterns to Avoid
Implementing a KPI program is full of traps. If you know what they are ahead of time, you can steer clear and maintain a healthy, trust-based culture.
The moment a metric is used as a weapon, it becomes useless as a tool for improvement. The primary purpose of a software development KPI program is to facilitate constructive conversations, not to assign blame.
Avoid these destructive habits at all costs:
- Weaponizing Metrics: Never use a KPI to call out an individual in a team meeting. The data is there to analyze the process, not to criticize people.
- Focusing on Vanity Metrics: Tracking "lines of code" or "number of commits" just encourages busywork, not valuable output. Stick to metrics that are tied to real outcomes.
- Ignoring the Context: A spike in Cycle Time isn't automatically a sign of inefficiency. It could mean the team was tackling a complex, high-value project. Always ask, "what's the story behind this number?" before jumping to conclusions.
By following this roadmap, you can build a KPI program that serves its true purpose: empowering your team, removing friction, and fostering a culture where everyone is invested in building better software, together.
Got Questions About Software Development KPIs? We've Got Answers
So, you understand what software development KPIs are, but actually putting them into practice can feel like opening a can of worms. Teams often get stuck wondering if they're tracking the right things, how to make sense of the data, and what to do when the numbers aren't exactly flattering.
This section is your go-to guide for those nagging questions. Think of it as a quick FAQ to clear up the common sticking points. The goal here is to reinforce one core idea: KPIs are tools for empowerment, not instruments for micromanagement. They should spark productive conversations and drive real improvements, not create a culture of fear.
How Many KPIs Should My Team Track?
This is easily the most common question, and the answer is almost always the same: fewer than you think.
It's tempting to track everything, but drowning your team in a dozen different dashboards just creates noise, not clarity. It leads to "analysis paralysis," where everyone spends more time staring at graphs than actually doing something about them.
Instead, a much better approach is to focus on just a handful of high-impact metrics that tie directly to a specific problem you're trying to solve right now.
*   **Start Small:** Pick one metric from the "speed" category (like **Cycle Time**) and one from the "quality" category (like **Change Failure Rate**). This gives you a balanced view of your process without overwhelming everyone.
*   **Focus on a Problem:** If your team feels like code reviews are a major bottleneck, don't worry about anything else at first. Just track **PR Pickup Time** and **PR Review Time**. Once that process gets smoother, you can shift your focus to the next biggest headache.
The point of KPIs is to solve a problem, not to track everything just for the sake of it. A few well-chosen metrics are far more powerful than a sprawling, unfocused dashboard that nobody ever looks at.
What Is the Most Important Software Development KPI?
If you had to pick just one, many experienced engineering leaders would point to Cycle Time. Why? Because it’s a powerful, all-encompassing indicator of your entire workflow's health, from the first line of code to the final deployment.
Cycle Time is so crucial because it measures the raw speed at which you deliver value. A consistently low Cycle Time is rarely an accident. It’s the result of a well-oiled machine: small PRs, fast reviews, a reliable CI/CD pipeline, and clear communication.
If your Cycle Time is high, it's a huge red flag that there's a significant bottleneck somewhere in your process that needs attention.
While DORA metrics give you a balanced scorecard, Cycle Time often acts as the "check engine" light for your entire development process. If it starts flashing, you know it's time to look under the hood.
How Do We Measure Developer Satisfaction?
This is a fantastic question because it gets beyond pure process metrics. In recent years, developer satisfaction has emerged as a vital—though often underrated—KPI. It has direct links to team velocity, talent retention, and the quality of the final product. It turns out that happy, unblocked developers write better code, faster. You can learn more about how optimizing workflows impacts team performance and overall success.
Measuring satisfaction doesn't have to be a huge, complicated initiative. Here are a few practical ways to get started:
- Simple, Regular Surveys: Use a lightweight tool to send out a short, anonymous survey every couple of weeks. Ask simple questions like, "On a scale of 1-5, how would you rate your experience as a developer this sprint?" or "What was the single biggest point of friction for you in the last two weeks?"
- Focus on Qualitative Feedback: The real gold is in the comments. Look for recurring themes. Are developers constantly fighting with a flaky CI/CD pipeline? Are they frustrated by vague requirements? This feedback points you directly to the highest-impact improvements you can make.
- Track Proxy Metrics: You can also get a sense of satisfaction from other KPIs. For example, a sudden drop in Merge Frequency or a spike in the Rework Rate might be a sign that the team is struggling with a particular part of the codebase or process, which is a classic source of frustration.
By actively listening to your team and clearing the roadblocks they face, you're not just improving morale. You're making a direct investment in the speed and quality of your entire engineering organization. It's a win-win that pays off in a big way.
Ready to eliminate your biggest code review bottleneck? PullNotifier delivers real-time, actionable pull request updates directly in Slack, cutting through the noise so your team can focus on shipping great code. Slash your PR review time and get started for free at https://pullnotifier.com.