- Published on
What Are Dora Metrics: what are dora metrics and how they power delivery
- Authors

- Name
- Gabriel
- @gabriel__xyz
DORA metrics are the four vital signs for any software development team. Coined by Google's DevOps Research and Assessment (DORA) team, they give you a clear, data-driven look at both the speed and quality of your engineering process. Forget gut feelings—these metrics tell you what’s really going on.
Understanding the Four Vital Signs of Software Delivery

Think of your engineering pipeline like a high-performance engine. You wouldn't just guess if it's running well; you'd check the gauges—speed, oil pressure, temperature. DORA metrics are those gauges for your delivery process. They’re not just abstract numbers but powerful diagnostic tools that show how quickly and reliably you’re delivering value to your users.
The whole DORA framework came out of years of rigorous research at Google. Their goal was simple: find out what actually separates high-performing teams from everyone else. The result was a set of four straightforward yet profound metrics that have become the gold standard for measuring engineering health.
The Core Components of DORA
The metrics are split into two key categories, giving you a balanced view of your team's throughput and stability.
*   **Speed Metrics:** These track how fast your team can get an idea from a developer's keyboard into production.
*   **Stability Metrics:** These measure the quality and reliability of the code you ship.
This dual focus is what makes the framework so powerful. It stops teams from chasing speed at the expense of quality, or getting so bogged down by caution that their delivery grinds to a halt. The goal is to get faster and more stable at the same time.
Here's a quick overview of what each metric tracks and why it's so important.
The Four DORA Metrics at a Glance
| Metric Name | What It Measures (The 'What') | Why It Matters (The 'Why') |
|---|---|---|
| Deployment Frequency | How often you successfully release to production. | A higher frequency indicates a more efficient, automated, and confident delivery pipeline. |
| Lead Time for Changes | The time it takes from code commit to production deployment. | A shorter lead time means you can respond to market needs and deliver value faster. |
| Mean Time to Restore | How long it takes to recover from a failure in production. | A lower MTTR shows your team is resilient and can resolve issues without major user impact. |
| Change Failure Rate | The percentage of deployments that cause a failure in production. | A lower failure rate points to better testing, review processes, and overall code quality. |
These four metrics work together to give you a holistic picture of your engineering team’s performance.
Elite teams prove you don't have to choose between speed and stability. They deploy code multiple times a day, with changes taking less than an hour to go from commit to production. And here’s the kicker: their deployments fail less than 15% of the time. When a failure does happen, they restore service in under an hour.
This isn’t just about bragging rights. Top-tier DORA performance translates directly to business success. According to extensive industry reports, companies achieving elite status are 208% more profitable. You can dig into the performance benchmarks and their business impact to see the data for yourself.
At their core, DORA metrics create a shared language for developers, operations, and business leaders. They get everyone aligned on the same goals: shipping better software, faster, and building an engineering culture that’s both resilient and predictable.
Ultimately, understanding what are DORA metrics is the first step toward building a high-performing engineering organization that can consistently hit its goals and keep users happy.
What Are the DORA Metrics, Really?
To get a real feel for DORA metrics, you have to look past the textbook definitions. These aren't just numbers you track on a dashboard; they're interconnected signals that tell you the story of how your team builds and ships software.
Let's break down what each metric actually measures using some simple analogies. This will help us see what "good" looks like and how they all work together to give you a complete picture of your engineering team's health.
1. Deployment Frequency: Your Factory's Output Rate
Deployment Frequency is probably the most straightforward of the four. It simply measures how often you successfully release code to production. Think of it as the pulse of your delivery pipeline.
Imagine your software development process is a high-tech factory. Deployment Frequency is its output rate. A factory that ships products only once every six months is way less responsive and efficient than one shipping multiple times a day.
*   **A high Deployment Frequency** points to a healthy, automated, and confident delivery process. It tells you that your CI/CD pipeline is solid, your tests are reliable, and your team can ship small, incremental changes without breaking a sweat.
*   **A low Deployment Frequency** is often a symptom of friction somewhere in your system. This could be anything from manual deployment steps and long approval cycles to a deep-seated fear of breaking production. It also happens when teams bundle too many changes into massive, risky releases.
Elite teams deploy on demand, often several times a day. They don't get there by accident—it's the result of investing in automation and building a resilient system that turns deployments into a routine, low-stress event.
2. Lead Time for Changes: The Kitchen's Ticket Time
Lead Time for Changes measures how long it takes for a committed piece of code to make it into production. This is a powerful metric because it reveals the true efficiency of your entire development cycle, from the moment a developer writes the first line of code to the second it’s live for users.
Picture a busy restaurant kitchen. When an order comes in (a feature request), the "lead time" is how long it takes for the dish to go from the chef starting it to the waiter delivering it to the table. Long ticket times lead to unhappy customers, just like long lead times mean delayed value for your users.
This metric tracks the entire active development phase, including:
*   Time spent waiting for a code review
*   Time spent running tests in the CI pipeline
*   Time spent waiting for deployment approvals
A short Lead Time for Changes is a direct measure of your team’s agility. It reflects your ability to respond quickly to market demands, fix urgent bugs, and get new features out the door while they’re still fresh and relevant.
An elite team’s lead time is under one hour, a sign of a highly optimized workflow where code flows smoothly from commit to deployment with almost no delays. On the flip side, a lead time measured in weeks or months signals major bottlenecks that need fixing, like painfully slow code reviews or manual testing hurdles.
3. Change Failure Rate: Your Product's Defect Rate
Change Failure Rate measures the percentage of your deployments that cause a production failure, forcing you to scramble with a hotfix, rollback, or patch. This metric is all about quality and stability. It answers the simple question: "When we ship code, does it actually work?"
Let's jump back to our factory analogy. Your Change Failure Rate is like your product defect rate. If a huge percentage of your products come off the assembly line broken, you don't have a reliable manufacturing process, no matter how fast you produce them.
A deployment is considered a failure if it:
*   Causes a service outage or performance degradation.
*   Requires an urgent hotfix to patch a critical bug.
*   Needs to be rolled back to a previous version.
A low Change Failure Rate (under 15% for elite teams) shows that quality is baked into your development process from the start. This is usually the result of strong automated testing, thorough code reviews, and smart practices like feature flags that allow for safer rollouts. A high rate suggests speed is being prioritized over stability, which always leads to rework and erodes user trust.
4. Mean Time to Restore: Your Emergency Response Time
When failures inevitably happen—and they will—Mean Time to Restore (MTTR) measures how long it takes your team to recover. This is the ultimate test of your resilience and how well you handle a crisis.
Think of MTTR as your system's emergency response time. When a fire alarm blares, how fast can the fire department show up and put out the blaze? A quick response minimizes damage and keeps everyone safe. In the same way, a low MTTR minimizes the impact on your users and protects your business.
This metric isn't about how long it takes to find the root cause; it’s about how quickly you can get the service back up and running. Elite teams often restore service in less than an hour. They pull off this incredible speed by having:
*   Advanced monitoring and alerting that spots issues instantly.
*   Well-practiced incident response playbooks.
*   The ability to quickly roll back a bad deployment or flip a feature flag off.
Together, these four metrics give you a balanced, holistic view. Speed, measured by Deployment Frequency and Lead Time, is kept in check by stability, measured by Change Failure Rate and MTTR. Nailing all four is the true mark of a high-performing engineering organization.
How to Measure and Benchmark Your DORA Metrics
Alright, so you understand what the DORA metrics are. Now for the real work: figuring out how to actually measure and use them. The good news is you don't need a fancy, complicated new toolset to get started. All the data you need is probably already sitting in the systems you use every single day.
The first step is simply to identify where that data lives. Think about your team's daily workflow. Your version control system, CI/CD pipeline, and project management software are absolute goldmines of DORA-related information. Each one holds a piece of the puzzle.
Finding Your Data Sources
To get a handle on the four DORA metrics, you can pull data straight from the tools you already have. You might start by doing this manually, but the real goal here is automation. Automating the data collection is how you get consistent, accurate insights over the long haul.
Here's where to look for the raw data for each metric:
*   **Deployment Frequency:** Your CI/CD tool (think [Jenkins](https://www.jenkins.io/), [GitLab CI](https://docs.gitlab.com/ee/ci/), or [CircleCI](https://circleci.com/)) is your source of truth. It logs every single successful deployment to production. Just count those up over a set period—like a week or a month—and you've got your frequency.
*   **Lead Time for Changes:** This one requires connecting two dots. You'll find the commit timestamp in your Git history and the deployment timestamp in your CI/CD logs. The time between those two points is your lead time.
*   **Change Failure Rate:** This is often the trickiest one to nail down. You have to connect deployments with production incidents. That means pulling data from your incident management tools (like [PagerDuty](https://www.pagerduty.com/) or [Opsgenie](https://www.atlassian.com/software/opsgenie)) and lining it up with your CI/CD deployment logs.
*   **Mean Time to Restore (MTTR):** Your incident management system has everything you need here. It records when an incident is opened and when it's resolved. Calculate the average time it takes to fix things, and that's your MTTR.
While grabbing this data by hand is a decent starting point, it's also tedious and prone to human error. Setting up a script or using a dedicated platform to automate this ensures your metrics are always up-to-date, giving you a real-time pulse on how your team is doing.
Setting Your Performance Benchmarks
Once you start collecting data, the immediate next question is, "So... are our numbers any good?" This is where DORA's performance benchmarks come into play. The research team behind DORA identified four distinct performance tiers—Elite, High, Medium, and Low—that help you see where your team stacks up against the rest of the industry.
These benchmarks aren't just for bragging rights. They give you a clear framework for setting realistic goals and figuring out where you can make the biggest impact. Knowing whether you're a "High" or "Medium" performer helps you focus your energy where it'll count the most.
The four core metrics are the pillars that define these performance benchmarks.
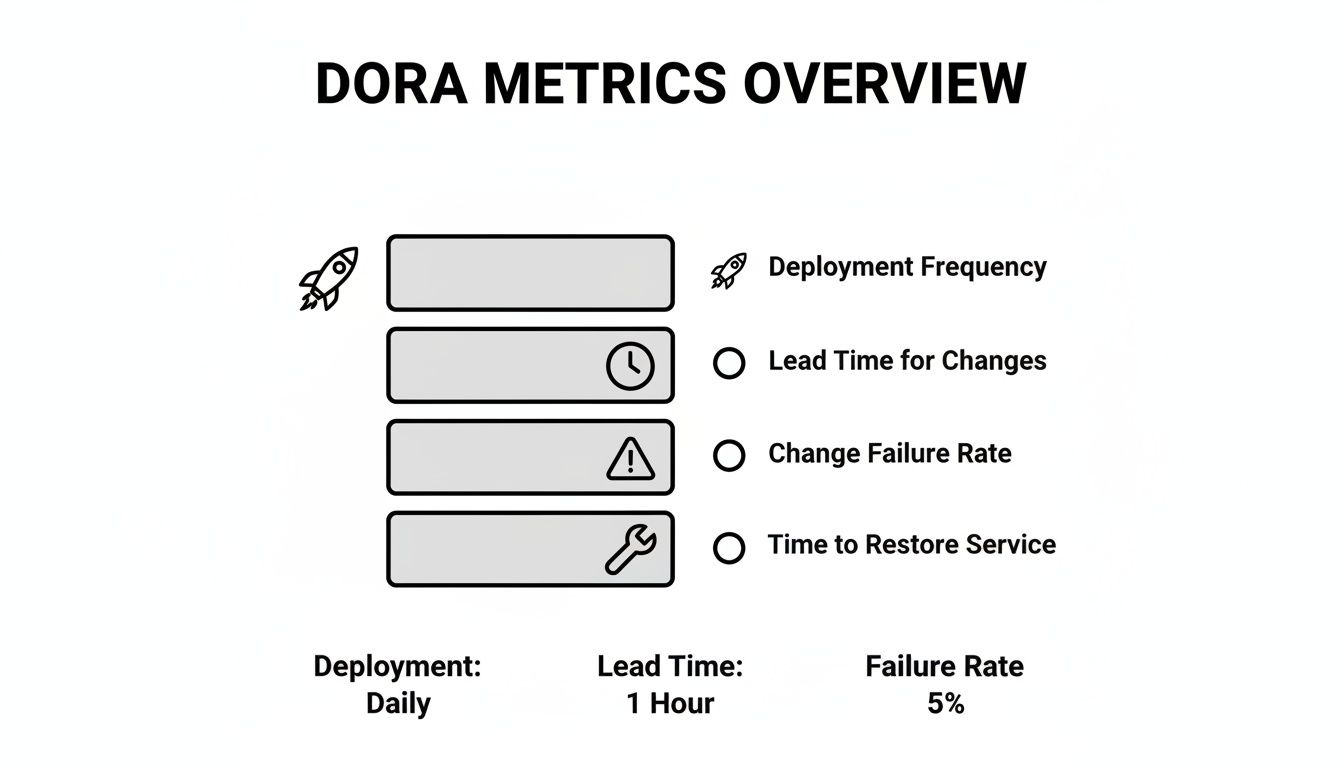
This visual shows exactly what elite teams master to consistently deliver high-quality software.
To give you a clearer picture, the table below breaks down the performance levels for each of the four DORA metrics. You can use it to see where your team is today and start mapping out a path to where you want to be.
DORA Performance Benchmarks Across Four Tiers
| Metric | Elite Performers | High Performers | Medium Performers | Low Performers |
|---|---|---|---|---|
| Deployment Frequency | On-demand (multiple times a day) | Between once per day and once per week | Between once per week and once per month | Less than once per month |
| Lead Time for Changes | Less than one hour | Between one day and one week | Between one month and six months | More than six months |
| Change Failure Rate | 0-15% | 16-30% | 16-30% | 46-60% |
| Mean Time to Restore | Less than one hour | Less than one day | Between one day and one week | More than one week |
Seeing your team's performance laid out like this is an eye-opener. It's a critical first step in a much broader strategy for measuring engineering productivity. For a deeper dive, check out our comprehensive guide to engineering productivity measurement.
Ultimately, knowing how to use DORA metrics goes beyond just benchmarking. It gives you practical insights into your team's workflow, helping you spot bottlenecks and inefficiencies. When teams apply this data, they can develop powerful strategies to reduce software development costs using DORA metrics simply by streamlining their processes. Measuring and benchmarking aren't just exercises—they're the foundational steps toward building a more efficient, reliable, and high-performing engineering culture.
Actionable Strategies to Improve Your DORA Metrics
Measuring your DORA metrics is like getting a map of your software delivery landscape—it shows you exactly where you are. But a map is only useful if you use it to get somewhere better. The real work begins when you use that map to find a faster, smoother route.
This means using targeted strategies to improve each of the four core metrics. Think of them as two sides of the same coin: speed (Deployment Frequency, Lead Time) and stability (Change Failure Rate, MTTR). Improving both creates a powerful engine for engineering excellence.

This isn't a solo mission. As you can see, it’s a team sport. Every strategy you implement should zero in on a specific bottleneck in your delivery pipeline, turning raw data into tangible improvements.
Boosting Your Deployment Frequency
High Deployment Frequency isn't about pushing code recklessly. It’s the result of a confident, low-friction release process where shipping code becomes a routine, non-stressful event. The key is to automate relentlessly and break down work into smaller, more manageable pieces.
A rock-solid CI/CD pipeline is non-negotiable here. It automates the entire build, test, and deploy cycle, ripping out manual handoffs and slashing the risk of human error. When deployments are just a button-click away, teams naturally start releasing small changes more often instead of bundling them into big, scary, high-risk releases.
To build a truly resilient and efficient pipeline, it’s worth diving into proven CI/CD pipeline best practices.
Here are a few things you can do right away:
*   **Automate Everything:** Your CI/CD pipeline should be a well-oiled machine, handling everything from building and unit testing to deploying in staging and production—all without human intervention.
*   **Embrace Small Batches:** Get developers into the habit of committing small, incremental changes. This makes code reviews faster, testing easier, and deployments safer.
*   **Use Trunk-Based Development:** When all developers work off a single main branch, you eliminate the nightmare of merging complex, long-lived feature branches. It simplifies integration and keeps the code flowing.
Slashing Lead Time for Changes
Lead Time for Changes measures the time from the first commit all the way to production. Long lead times are almost always caused by "wait states"—those frustrating periods where code just sits idle, waiting for a review, a manual test, or an approval stamp. To shrink this metric, you have to hunt down and eliminate those delays.
More often than not, the code review process is the biggest bottleneck. A pull request that sits for days waiting for feedback adds a massive drag to your lead time. This is where tools that bring visibility and clear communication to the forefront really shine.
Elite teams get their Lead Time for Changes under one hour. But what about everyone else? Analytics from one team showed their median time from opening a PR to getting a first response was just 10 minutes—great! But the full cycle time stretched to a painful 22 hours and 36 minutes across 232 PRs. That data screams for optimization.
Tools like PullNotifier directly attack this problem. Instead of a chaotic firehose of GitHub alerts, it funnels notifications into focused Slack threads. Teams get clean, actionable updates, which can cut notification noise by up to 90% and keep PRs moving.
To cut down your lead time:
*   **Optimize Code Reviews:** Use tools that integrate with Slack to provide real-time, non-intrusive PR updates. This keeps reviewers in the loop without drowning them in notifications.
*   **Automate Test Suites:** Your automated tests need to run fast and give immediate feedback. A developer shouldn’t have to wait an hour just to find out their change broke a test.
*   **Implement Feature Flags:** Decouple deployment from release. This lets you merge and deploy code straight to production behind a feature flag, turning it on for users only when you're absolutely ready. For more on this, check out our guide on [7 proven strategies to reduce cycle time](https://blog.pullnotifier.com/blog/7-proven-strategies-to-reduce-cycle-time-in-2025).
Lowering Your Change Failure Rate
A low Change Failure Rate is a clear signal of a high-quality, stable delivery process. Shipping fast is great, but it’s worthless if your changes are constantly breaking production. The goal isn't to add quality checks at the end; it's to build quality into every single step of your workflow.
Your first line of defense is comprehensive automated testing. This includes unit tests, integration tests, and end-to-end tests that validate functionality long before code ever sees a real user. Catching bugs early prevents them from becoming production fires.
Other effective strategies include:
*   **Peer Reviews and Pair Programming:** A second set of eyes on every line of code is still one of the best ways to catch logic errors and potential bugs.
*   **Staging Environments:** A production-like staging environment lets you do a final validation before a full rollout, catching tricky issues related to configuration or infrastructure.
*   **Canary Releases:** Roll out changes to a small slice of users first. This limits the blast radius if something goes wrong and lets you roll back quickly with minimal impact.
Shortening Your Mean Time to Restore
Let’s be realistic: even with the best processes, failures will happen. Your Mean Time to Restore (MTTR) is the ultimate test of how quickly you can recover from them. A low MTTR is the hallmark of a resilient system and a well-prepared team. The goal isn't just to fix the issue, but to restore service to your users as fast as humanly possible.
This requires two things: excellent observability and a clear, well-rehearsed incident response plan.
Observability tools that give you deep insights into your system's health are non-negotiable. When an incident strikes, your team needs immediate, context-rich alerts that pinpoint the problem, not vague notifications that send them on a wild goose chase.
To improve your MTTR:
*   **Invest in Monitoring and Alerting:** Use tools that provide detailed logs, traces, and metrics. Your alerts should be actionable and automatically routed to the right people.
*   **Automate Rollbacks:** Your CI/CD pipeline should make rolling back a failed deployment as simple as pushing a button. This is often the fastest path to restoring service.
*   **Practice Incident Response:** Don't wait for a real crisis to test your plan. Regularly run drills or "game days" where your team practices responding to simulated incidents. This builds muscle memory and ensures everyone knows their role when things go sideways for real.
Common Pitfalls When Adopting DORA Metrics
Adopting DORA metrics can be a game-changer for engineering teams, but it's easy to stumble into a few common traps along the way. Just throwing numbers on a dashboard won't get you far. The real magic happens when you start using these metrics as diagnostic tools, not as weapons.
One of the quickest ways to kill morale is by weaponizing metrics.
When leaders use DORA data to stack-rank individual developers, it poisons the well almost immediately. It kills collaboration and creates a culture of fear where engineers are more focused on gaming the system than actually improving it. You might see a developer split one logical change into ten tiny commits just to pump up their Deployment Frequency score, adding a ton of noise without any real value.
The purpose of tracking DORA metrics is to diagnose system-level bottlenecks, not to rank individual performance. The moment they become a tool for comparison, they lose their power to drive genuine, collaborative improvement and instead create perverse incentives.
This approach completely misses the point. DORA metrics are there to shine a light on process problems—like sluggish code reviews or a flaky test suite—that are slowing the whole team down.
Focusing on Speed at All Costs
Another classic mistake is chasing elite-level speed (Deployment Frequency and Lead Time for Changes) while completely ignoring stability. Teams get so fixated on shipping faster that they start cutting corners on important stuff like testing and code reviews.
What happens next is predictable: the Change Failure Rate skyrockets, and the Mean Time to Restore gets longer because everything is constantly on fire.
Suddenly, your developers are spending more time putting out production fires than building new features. Any speed you thought you gained is lost in the chaos of rollbacks and frantic hotfixes. It's a vicious cycle that tanks developer morale and erodes user trust.
A healthy DORA practice is always about balancing speed with quality. To get this right, check out our deep dive on the trade-offs between code quality vs. delivery speed and how to manage them.
Misinterpreting the Data
Without context, DORA metrics can be flat-out misleading. A sudden drop in Deployment Frequency might look bad on a chart, but what if the team was heads-down on a complex, high-impact project? On the flip side, a 0% Change Failure Rate might not mean you're perfect; it could mean your team is too scared to take risks or innovate.
To get the real story, you have to talk to your team. Use the metrics to start a conversation, not end one. Ask questions like:
*   **Why did our Lead Time for Changes jump last sprint?** Was it a complicated feature, or were PRs just sitting in the review queue for days?
*   **Is our super-low Change Failure Rate a sign of great quality, or are we playing it too safe?**
*   **What’s the single biggest thing holding us back from deploying more often?**
These conversations are what turn raw numbers into insights you can actually act on.
Believing They Are Only for Startups
Finally, a lot of established companies fall into the trap of thinking DORA metrics are just for nimble startups with brand-new codebases. They look at their legacy systems and complex processes and assume elite performance is out of reach.
This is just a limiting belief.
Sure, the path might be tougher, but the principles behind DORA apply to any team, anywhere. The goal isn't to hit "elite" status overnight. It's about figuring out your baseline and then making small, steady improvements to your delivery pipeline. By knocking down one bottleneck at a time, any team can use what are DORA metrics to build a more efficient, stable, and sane engineering culture.
Alright, let's wrap this up. We've gone from defining what DORA metrics are to digging into real, practical ways to make them work for you.
Getting to elite performance isn't a race to hit some arbitrary number on a dashboard. It’s about building a culture where speed and stability aren't at odds—they're two sides of the same coin.
DORA gives your whole engineering org a common language. It takes those gut feelings about what’s slow and turns them into hard data, shining a light on the exact friction points in your delivery pipeline. Every fix, whether it's automating a deployment to ship more often or tightening up code reviews to slash lead times, becomes a deliberate step forward. Think of it less like a set of KPIs and more like a proven blueprint for getting value to your users, faster and without breaking things.
The trick to adopting DORA is realizing it's a marathon, not a sprint. Start small, get a win, and let the data guide you from there.
So, where do you start? Just pick one metric. Seriously, that's it.
Maybe you decide to tackle Lead Time for Changes. You could use a tool like PullNotifier to get your code review process humming and kill those long, frustrating waits. By zeroing in on one high-impact area, you can score a quick win that proves to everyone how powerful this data-driven approach can be.
From that first small victory, you build momentum. You move to the next bottleneck, and the next, until your team's workflow is a smooth, predictable engine for getting great work done. The path is clear, the tools are ready. For any team serious about building better software, DORA isn't just a theory—it's the most rewarding road you can take.
Got Questions About DORA Metrics?
When engineering leaders first start digging into DORA metrics, a few practical questions almost always come up. Getting these sorted out early helps smooth the path for your team and makes sure everyone’s on the same page.
One of the first things people ask is, "Do we need to buy some expensive new tool to get started?" The answer is a hard no. You can get a baseline going with the tools you already use every day, like Git and your CI/CD platform. Honestly, a simple spreadsheet is more than enough to get the ball rolling.
How Do DORA Metrics Work for Different Teams?
Another common worry is whether these metrics are a good fit for every team. "Are DORA metrics just for big enterprise teams or certain types of projects?" Not at all. The underlying principles are useful for pretty much everyone.
*   **Small Teams vs. Large Enterprises:** Whether you’re a five-person startup or a massive corporation, the goal is the same: get a little bit better over time. DORA gives you a framework for that, no matter your size.
*   **Frontend vs. Backend:** These metrics apply just as well to both sides. A frontend team can track how often they ship UI updates (**Deployment Frequency**), while a backend team keeps an eye on API changes. The core ideas don't change.
It's really important to remember that you shouldn't be comparing DORA metrics between teams working on completely different things. A mobile app team is going to have a totally different release cadence than a team managing a mature, stable backend service. That's just a fact.
The point isn't to pit Team A against Team B. It's about helping a team measure its own performance against its own history. The focus should always be on your team’s unique journey of improvement.
This mindset keeps the metrics useful and constructive, turning them into a tool for growth instead of a source of unhealthy competition. Figuring out what DORA metrics mean in your specific context is the key to making them work for you.
Stop letting pull requests get stuck in review. PullNotifier integrates GitHub with Slack to deliver clean, real-time PR updates, cutting through the noise and keeping your team's momentum high. Start your free trial today.